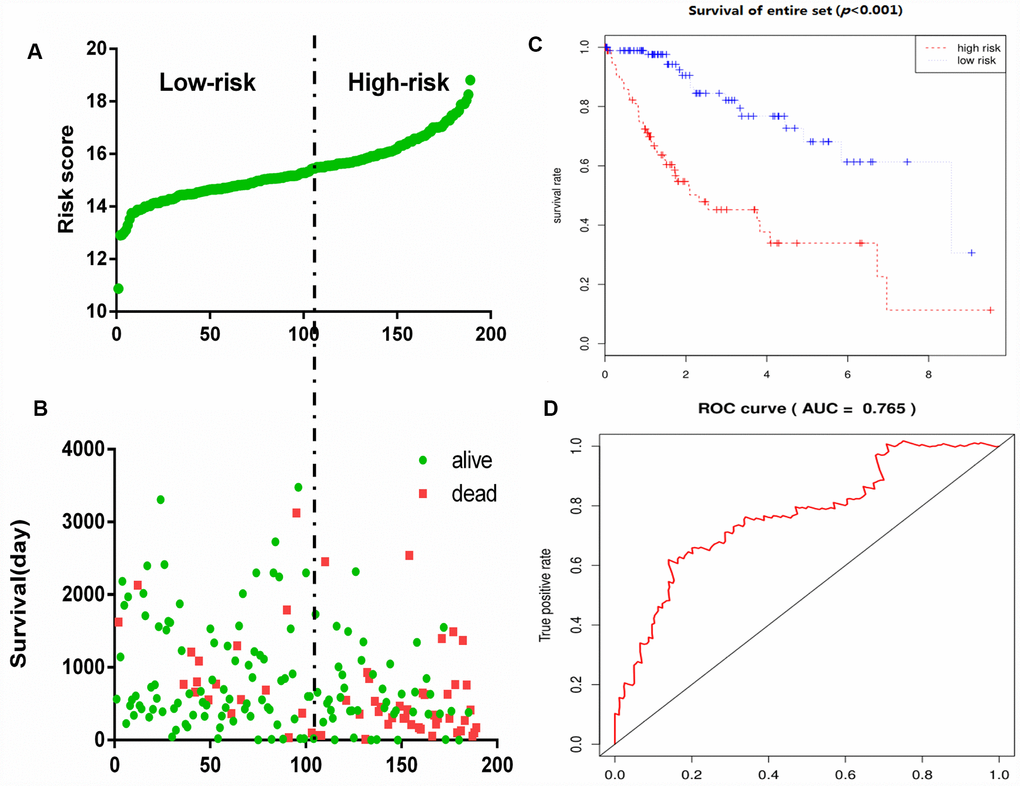
Figure 6.Glycolysis-related gene signature predicts OS in patients with HCC. (A) Distribution of risk scores per patient, (B) Relationship between survival days and survival status of each patients, (C) K-M curve to verify the predictive effect of gene signature, (D) ROC curve analysis to evaluate the diagnostic efficacy of gene signature.