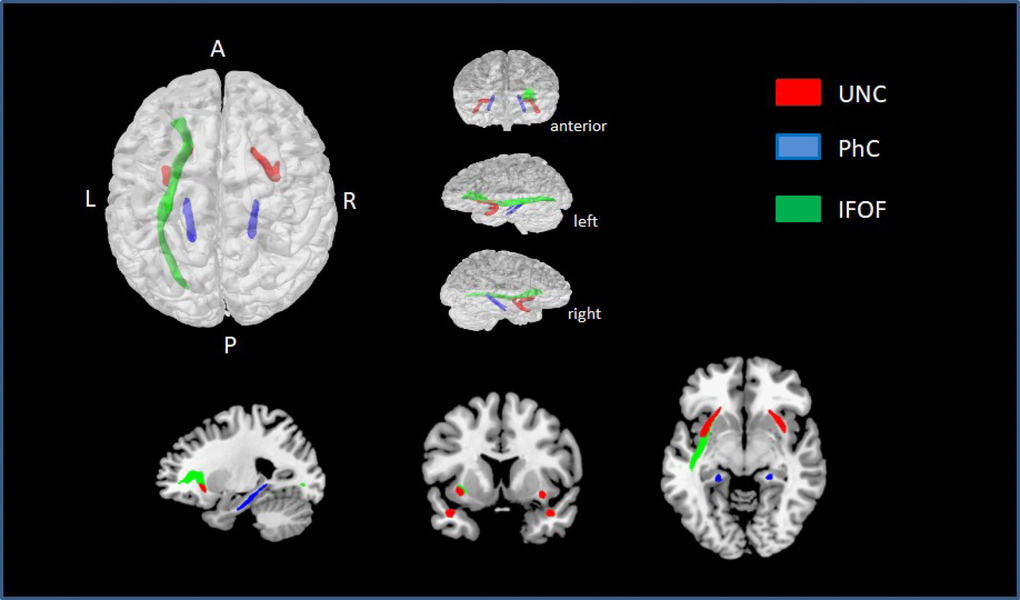
Figure 3.ROIs with statistically significant correlations between MD values and NProd (FDR q < 0.01). UNC is represented in red, PhC in blue, and left IFOF in green.
Figure 3 — Narrative impairment, white matter damage and CSF biomarkers in the Alzheimer’s disease spectrum | Aging