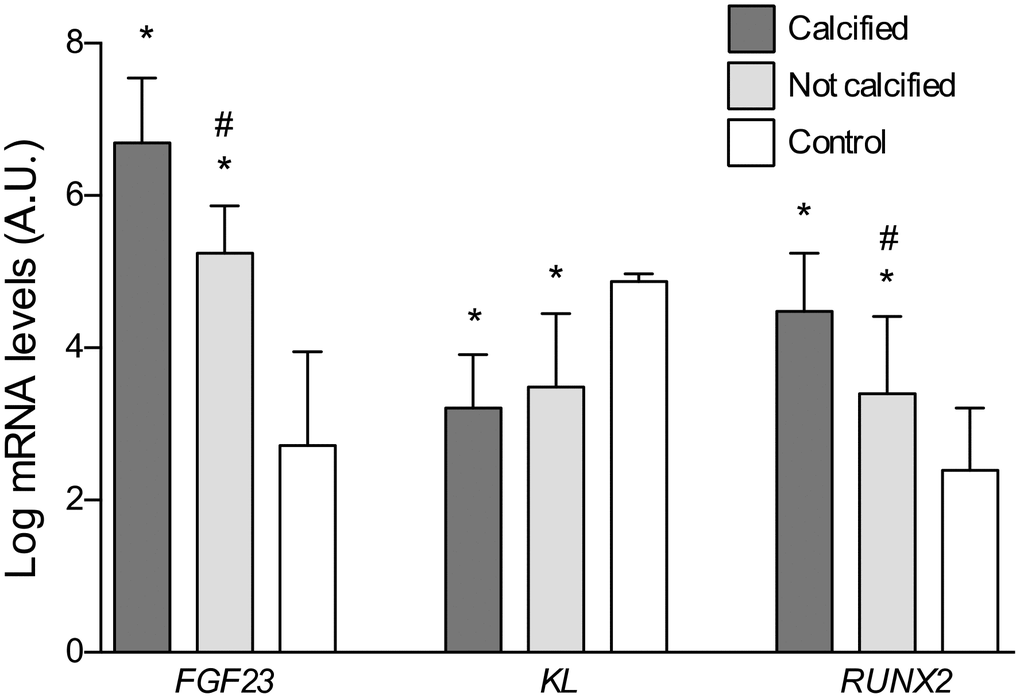
Figure 5.Differences in the log-transformed gene expression levels of FGF23, Klotho, and RUNX2 attending to the presence of calcification. *P<0.01 vs. control group; #P<0.01 vs. calcified group.
Figure 5 — Fibroblast growth factor 23 expression in human calcified vascular tissues | Aging