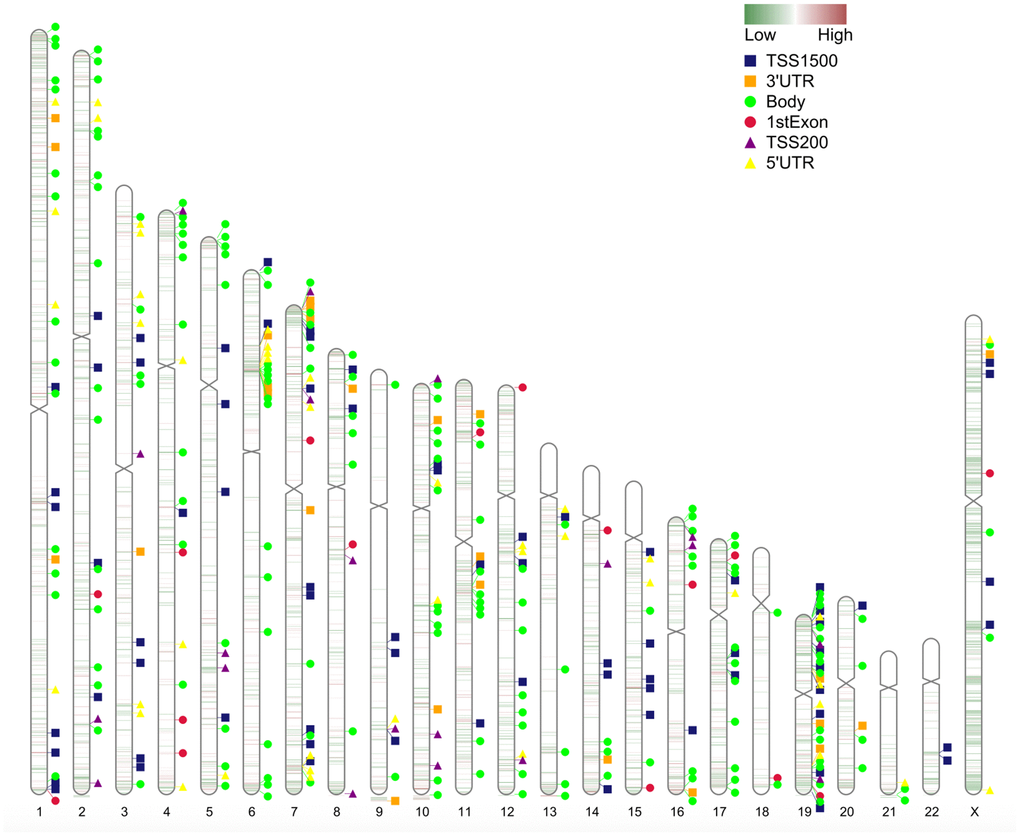
Figure 3.Chromosome distribution of differentially methylated intergenic CpGs. The plot presents the distribution of differential intergenic CpG sites at 22 autosomes and the X chromosome. Regions in red are hypermethylated regions, and regions in green are hypomethylated regions. The value is the logFC of the M value among asymptomatic and symptomatic patients.