Submit an Article
Navigate
Home
Editorial Board
Editorial Policies
Current Volume
Archive
Scientific Integrity
Publication Ethics Statements
Interviews with Outstanding Authors
Newsroom
Sponsored Conferences
Podcast
Contact
Special Collections
Submit an Article
Online ISSN: 1945-4589
Research Paper
|
Volume 11, Issue 16
|
pp. 6569–6583
Genetic variants of
ADAMTS7
confer risk for ischaemic stroke in the Chinese population
Back to article
Figure 3
(3 of 3)
−
100%
+
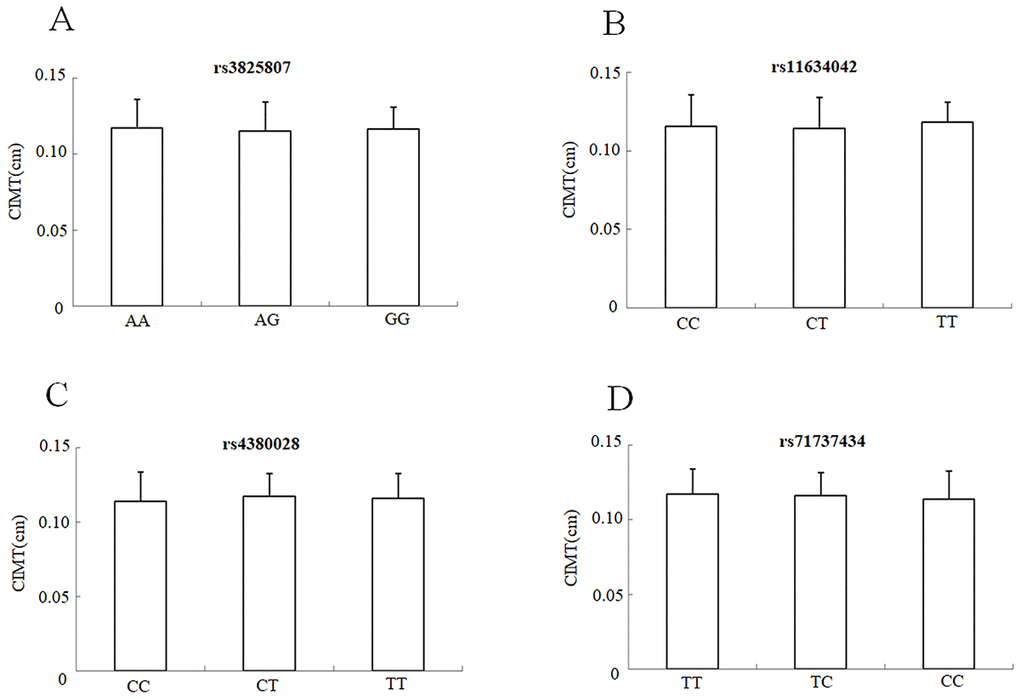
Figure 3.
CIMT mean values ± SD of IS patients (n = 264) stratified according to the genotypes and alleles of rs3825807. (
A
), rs11634042 (
B
), rs4380028 (
C
) and rs7173743 (
D
), respectively.