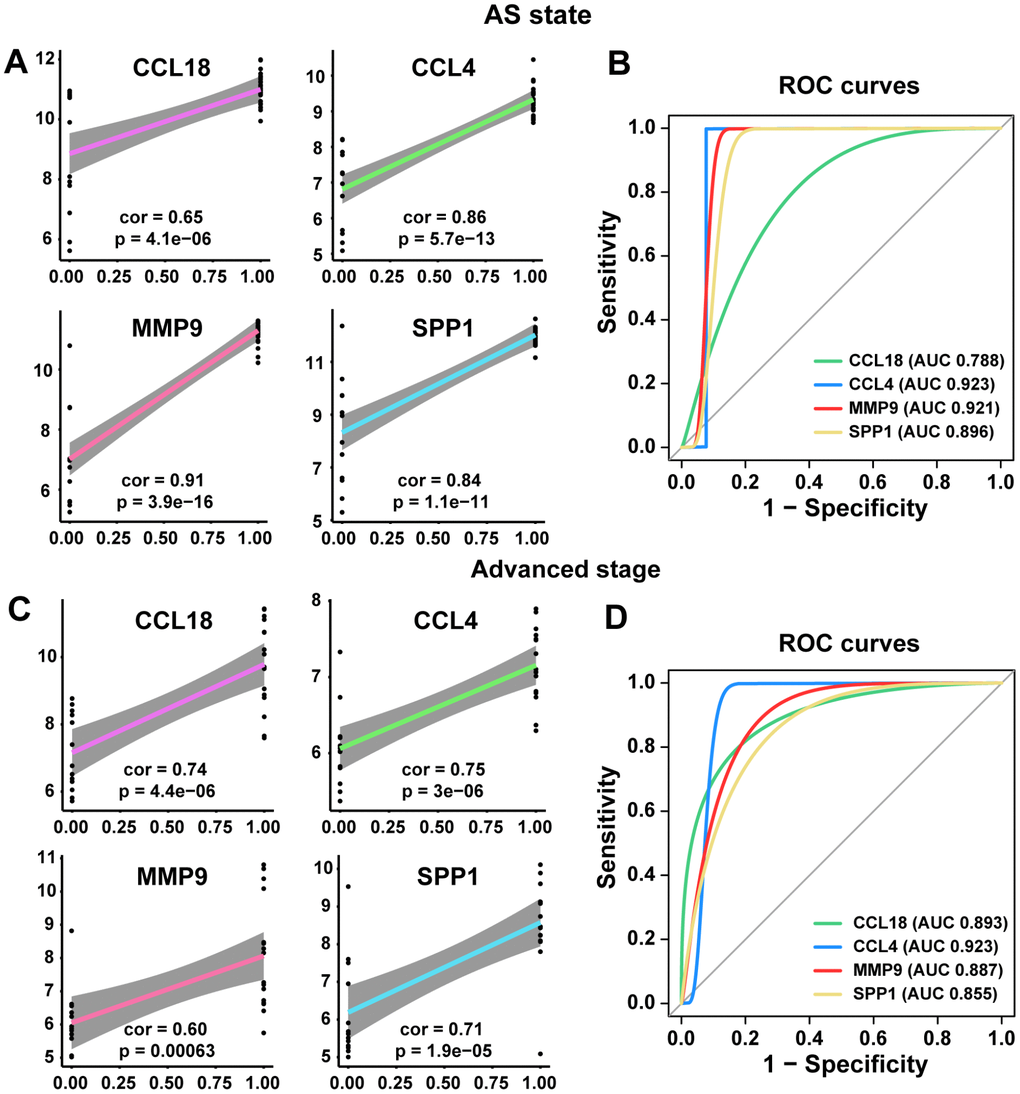
Figure 5.Linear regression analyses and ROC curve in training and poor prognosis sets. (A, C) The correlations of the expression of the 4 hub genes with AS state and advanced stage by linear regression analysis. (B, D) ROC curves of the 4 common hub genes for diagnosing the AS state or the advanced stage. According to one arbitrary guideline [31], we distinguished among excellent accuracy (0.9 ≤ AUC < 1), good accuracy (0.8 ≤ AUC < 0.9) and noninformative accuracy (AUC = 0.5).
Figure 5 — Identification and validation of four hub genes involved in the plaque deterioration of atherosclerosis | Aging