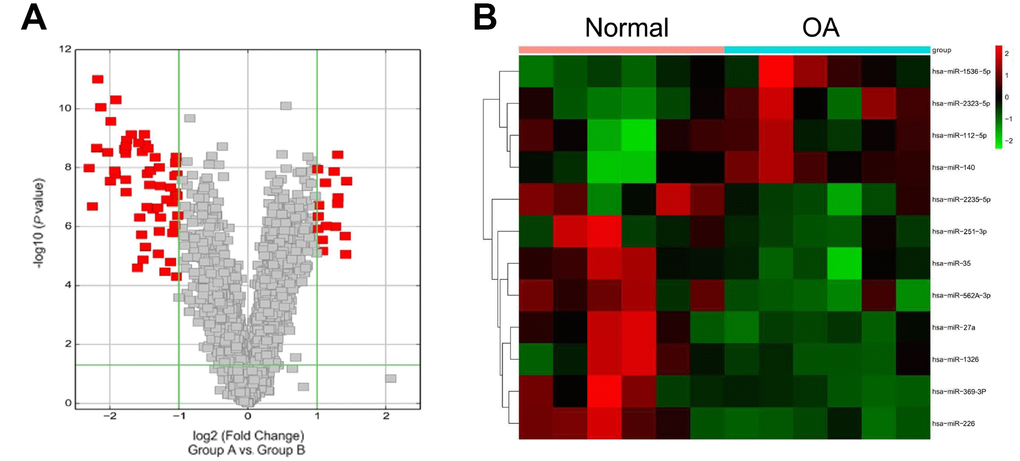
Figure 1.Microarray data. (A) Volcano plot displaying the alteration of microRNA (miRNA; 2-fold increase or decrease) expression versus p, as detected by the microarray analysis of OA patients relative to healthy controls. (B) Different expression levels of a set of microRNAs in OA patients and healthy controls. Green, low expression levels; red, high expression levels.