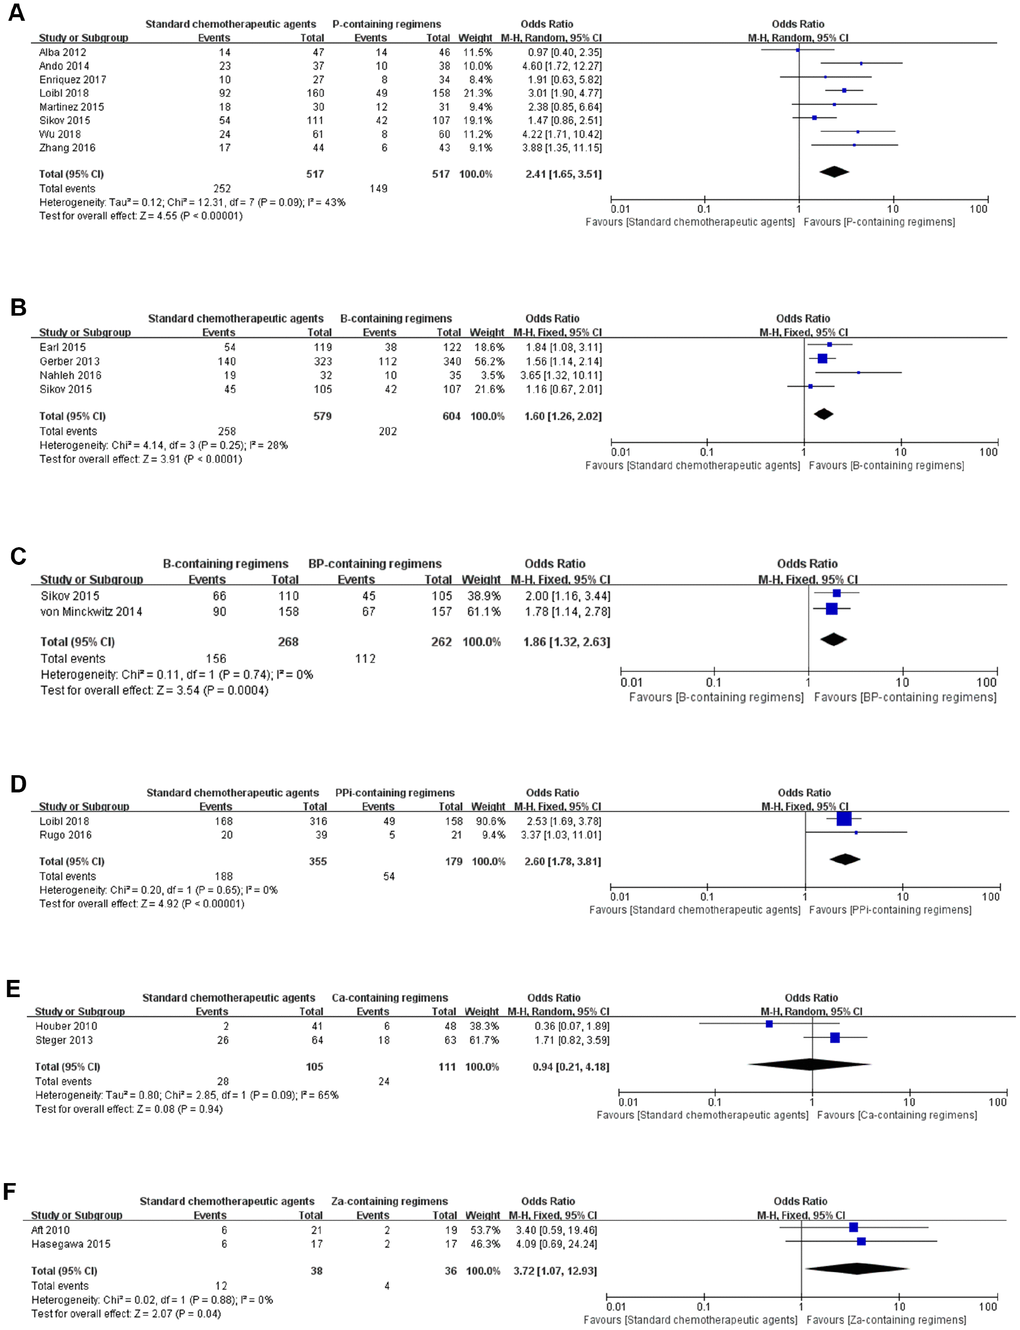
Figure 3.Forest plots of pair-wise meta-analyses for pathological complete response (pCR). (A) Standard chemotherapeutic agents vs. P-containing regimens. (B) Standard chemotherapeutic agents vs. B-containing regimens. (C) B-containing regimens vs. BP-containing regimens. (D) Standard chemotherapeutic agents vs. PPi-containing regimens. (E) Standard chemotherapeutic agents vs. Ca-containing regimens. (F) Standard chemotherapeutic agents vs. Za-containing regimens.