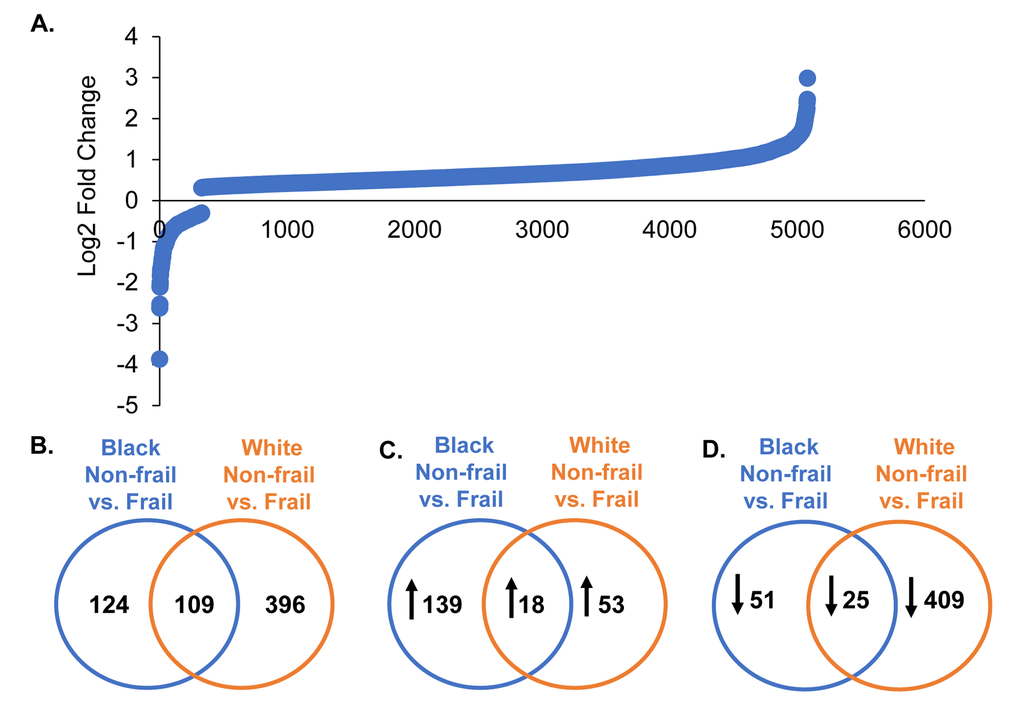
Figure 2.Global gene expression changes by frailty and race. Total RNA was isolated from PBMCs from non-frail and frail blacks and whites (n=16). Differential gene expression was assessed using RNA sequencing. The graph shows log2 fold change of genes significantly altered with frailty (5,082 genes) (A). A list of all these genes can be found in Supplementary Table 1. Venn diagrams of the total number of significant differentially expressed genes in blacks and whites with frailty (B). Significantly increased (C; up arrow) and decreased (D; down arrow) genes in blacks and whites with frailty.