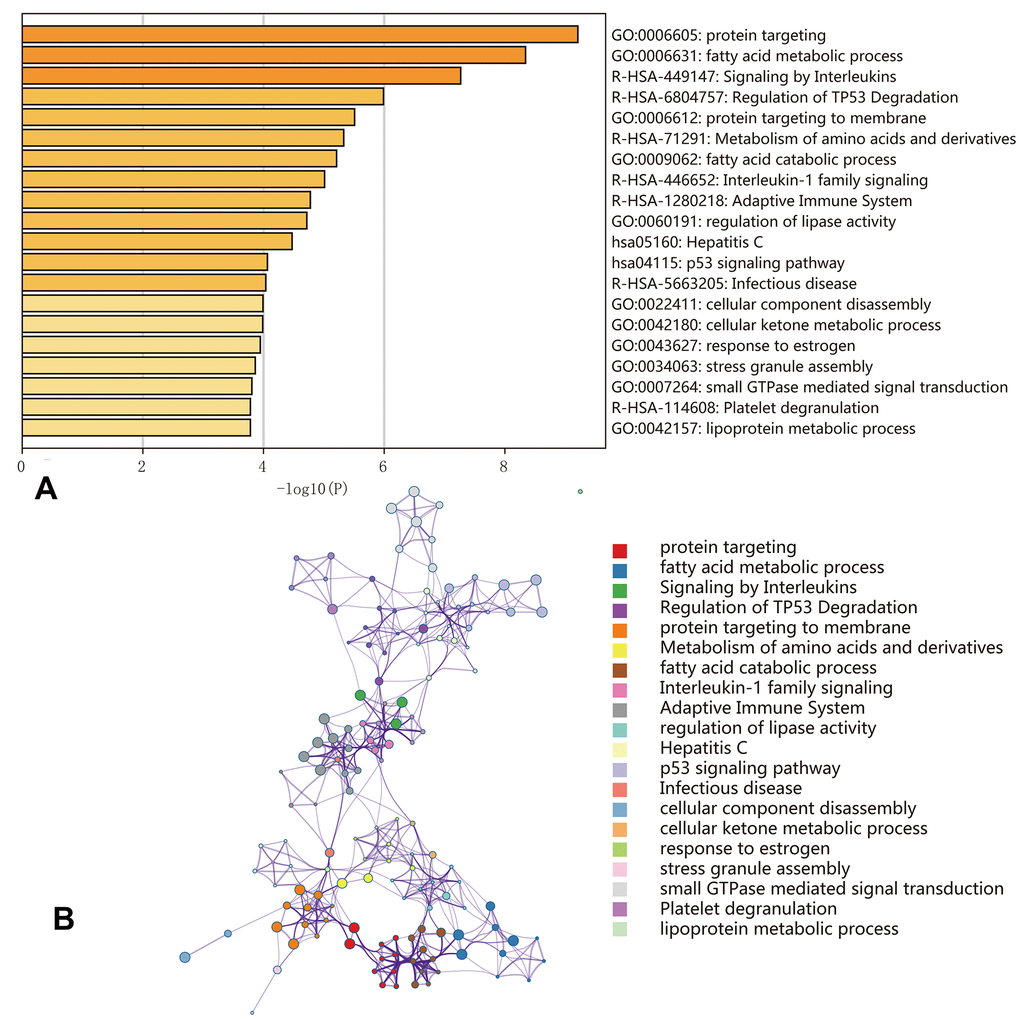
Figure 7.Enrichment analyses of the genes corresponding to the 500 most significant OS-SEs. (A) Bar graph showing the top 20 results from the enrichment analysis; (B) Enrichment analysis showing the gene networks and enrichment of various pathways. Colors correspond to different cluster IDs.