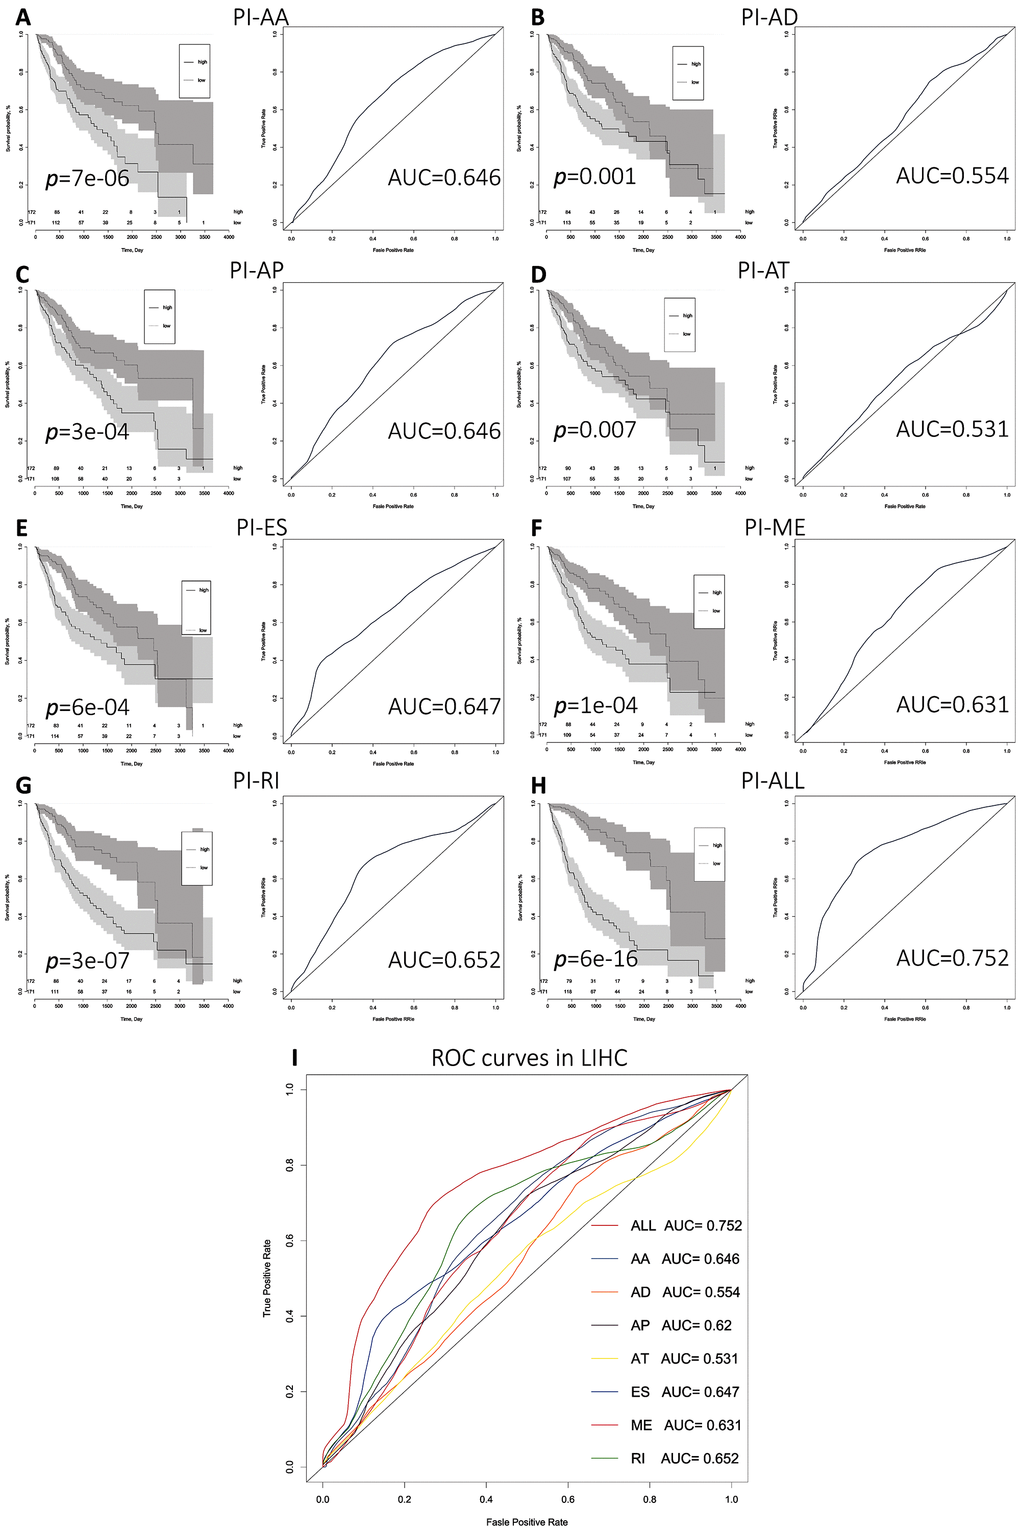
Figure 3.Comparison of the prognostic efficacy of the eight PIs for OS survival among HCC patients in the low and high risk subgroups. (A–I) Kaplan-Meier survival curves for patients in the low and high subgroups for each PI. Time-dependent ROC curves demonstrating the ability of each PI to predict patient survival after 2,000 days.