Submit an Article
Navigate
Home
Editorial Board
Editorial Policies
Current Volume
Archive
Scientific Integrity
Publication Ethics Statements
Interviews with Outstanding Authors
Newsroom
Sponsored Conferences
Podcast
Contact
Special Collections
Submit an Article
Online ISSN: 1945-4589
Research Paper
|
Volume 11, Issue 13
|
pp. 4720–4735
Alternative splicing events are prognostic in hepatocellular carcinoma
Back to article
Figure 2
(2 of 8)
−
100%
+
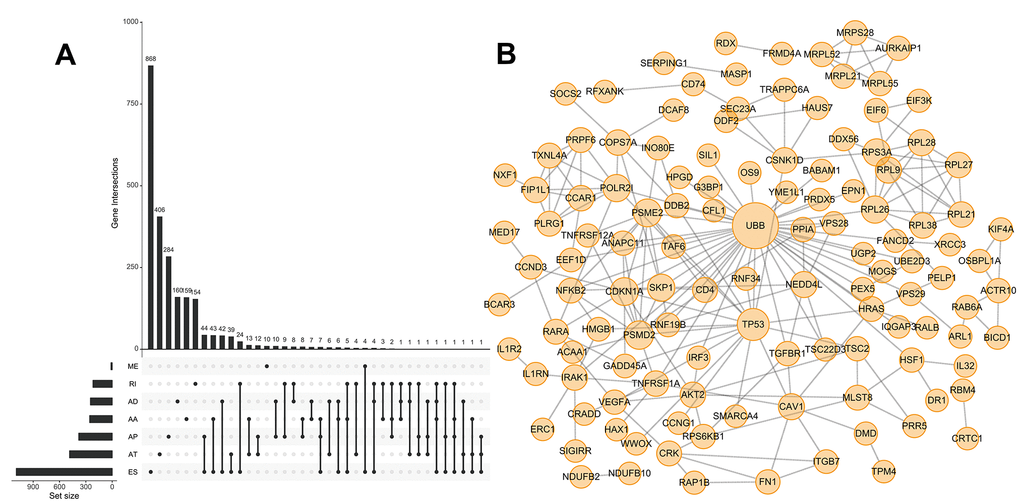
Figure 2.
UpSet plot of OS-SEs and gene interaction network in HCC.
(
A
) UpSet plot showing OS-SEs for HCC; (
B
) Gene interaction network showing all interactions between genes corresponding to the 500 most significant OS-SEs in HCC.