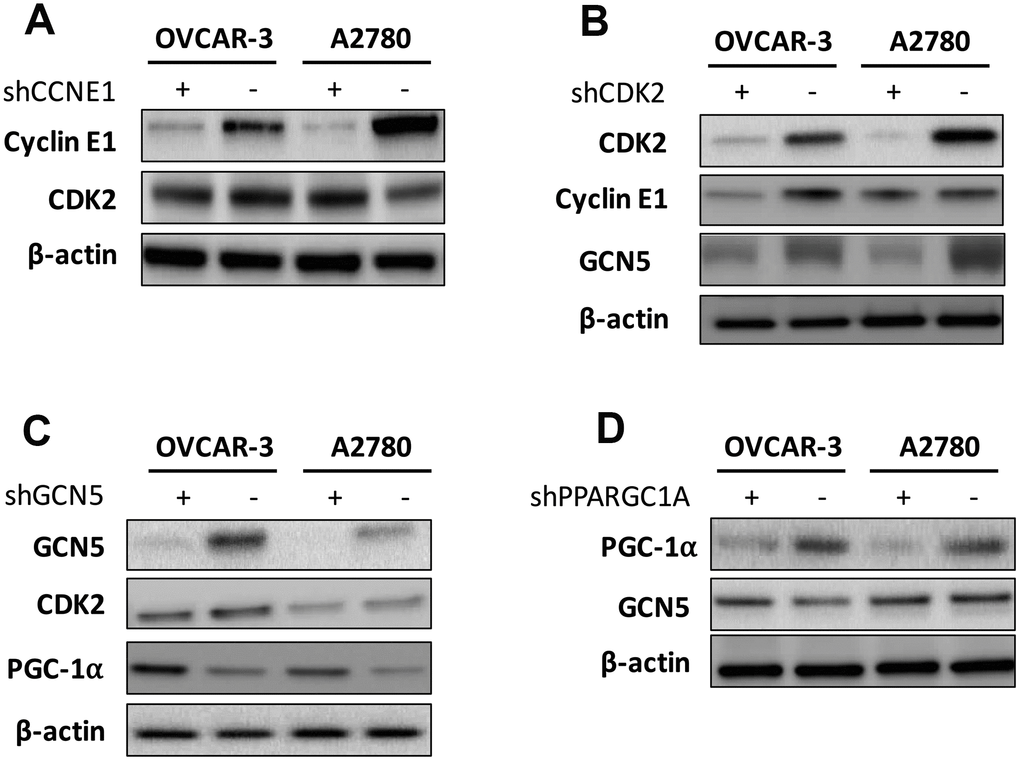
Figure 3.Shown are hierarchy of regulation demonstrating impact of (A) silencing of CCNE1 on CDK2; (B) silencing of CDK2 on Cyclin E1 and GCN5; (C) silencing of GNG5 on CDK2 and PGC-1α; and (D) silencing of PGC-1α onGCN5.
Figure 3 — GCN-5/PGC-1α signaling is activated and associated with metabolism in cyclin E1-driven ovarian cancer | Aging