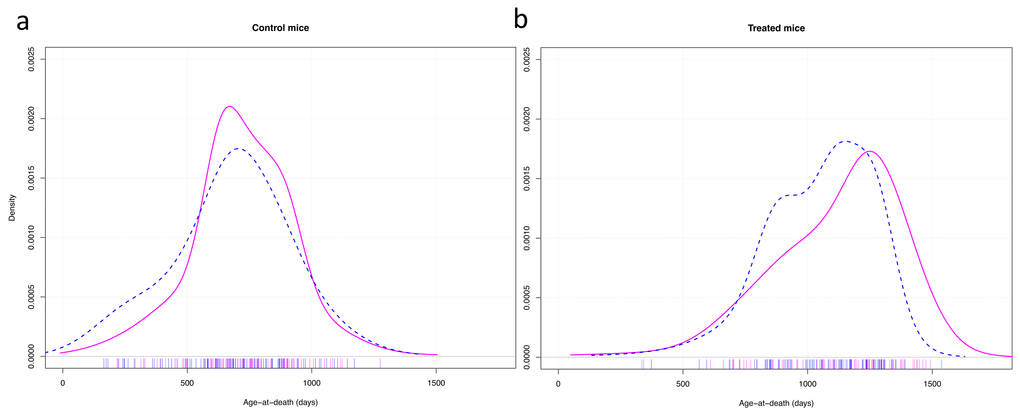
Figure 4.Density plots of the age of death of control mice (a) and mice treated with anti-aging diet as well as having anti-aging genotypes (b). Cox-test for difference between females (solid red) and males (dashed blue) in survival with strain as random effect variable: control mice: z = 0.57, p = 0.57; treated mice: z = 3.97, p < 0.001.