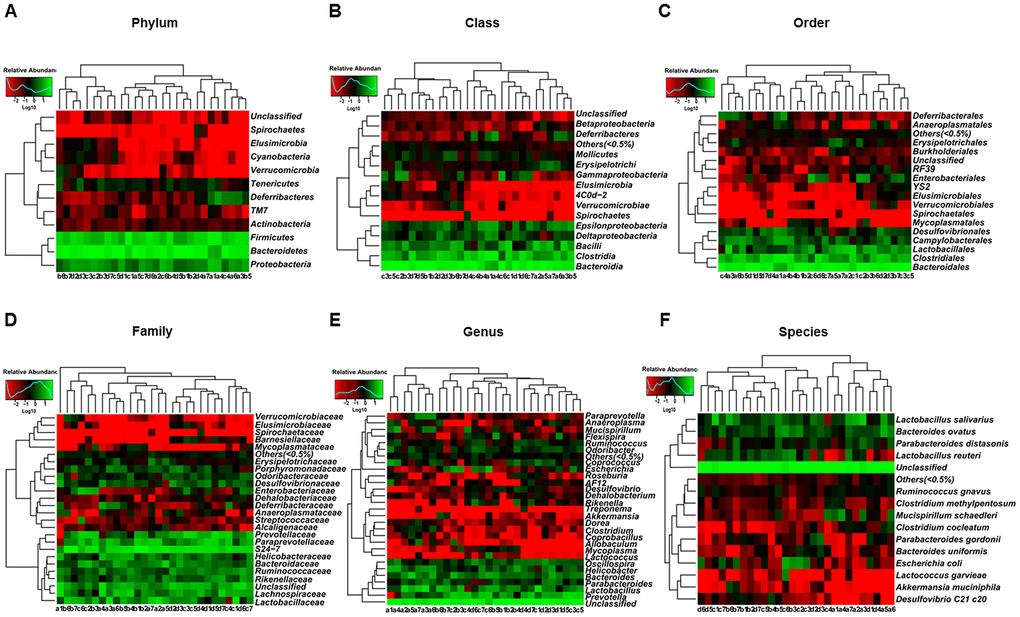
Figure 9.Heatmaps of gut microbiota composition in pseudo-germ-free mice following transplantation from CD and Non-CD diabetic mice. (A) Heatmap (phylum level). (B) Heatmap (class level). (C) Heatmap (order level). (D) Heatmap (family level). (E) Heatmap (genus level). (F) Heatmap (species level).