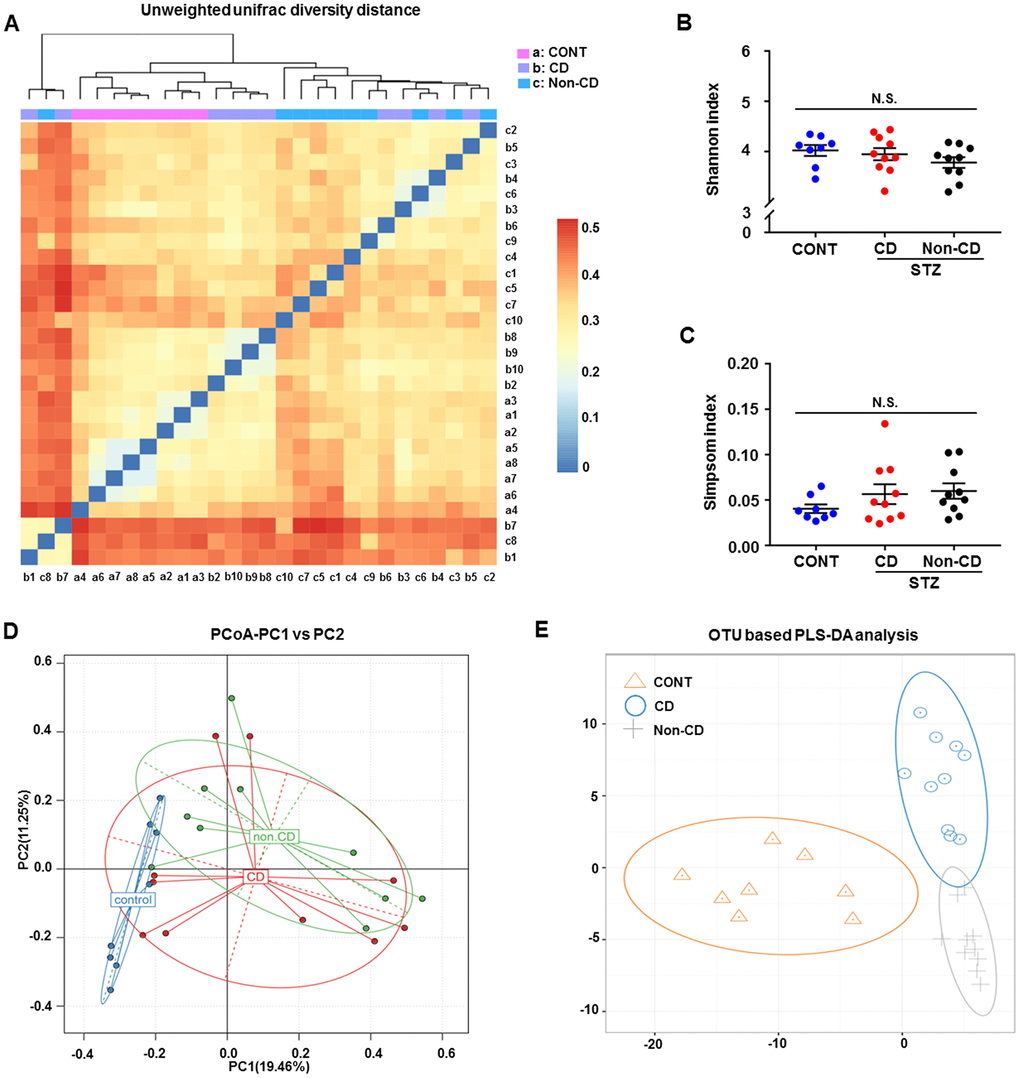
Figure 2.Differences in gut microbiota profiles among CONT, CD, and Non-CD mice. (A) Unweighted unifrac diversity distance. (B) Shannon index (one-way ANOVA; F2,25 = 1.17, p > 0.05). (C) Simpson index (one-way ANOVA; F2,25 = 1.272, p > 0.05). (D) PCoA analysis of gut bacteria (PC1 versus PC2). (E) PLS-DA analysis of gut bacteria. The α-diversity is shown as mean ± SEM (n = 8−10 individual fecal samples/group). ANOVA: analysis of variance; CD: cognitive dysfunction; CONT: control; N.S.: not significant; PCoA: principal coordinate analysis; PLS-DA: partial least squares discrimination analysis; SEM: standard error of the mean.