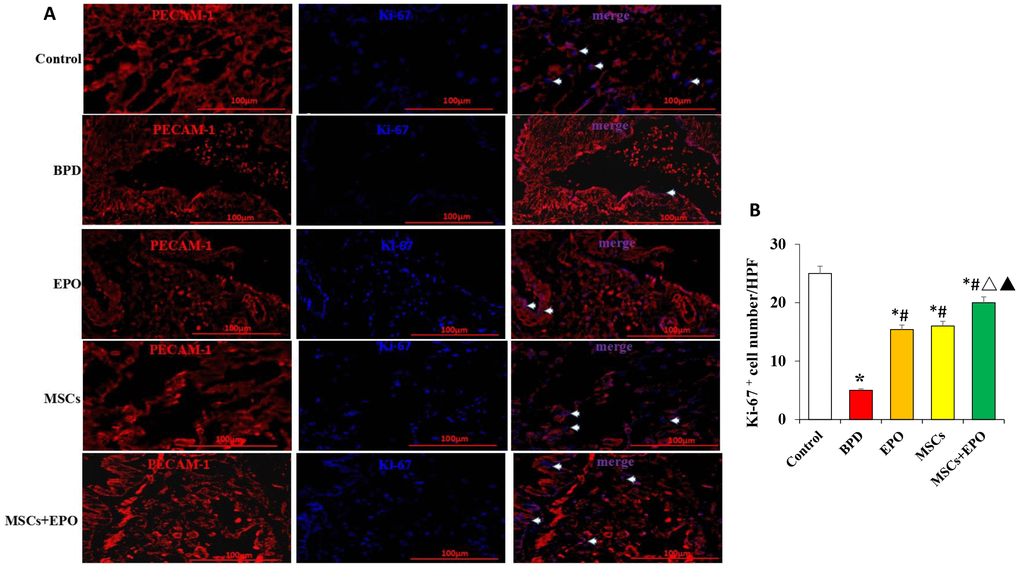
Figure 3.Immunofluorescence analysis of the proliferative activity of microvascular endothelium in vivo. (A) Ki-67 (blue) and PECAM-1 (red) double staining using a light microscope at ×400 magnification. (B) Comparative analysis of the OD value in each group. Data are presented as the mean ± SD. *P < 0.05 compared with the control group; #P < 0.05 compared with the BPD group; △P<0.05 compared with the EPO; ▲P<0.05 compared with the MSCs group.