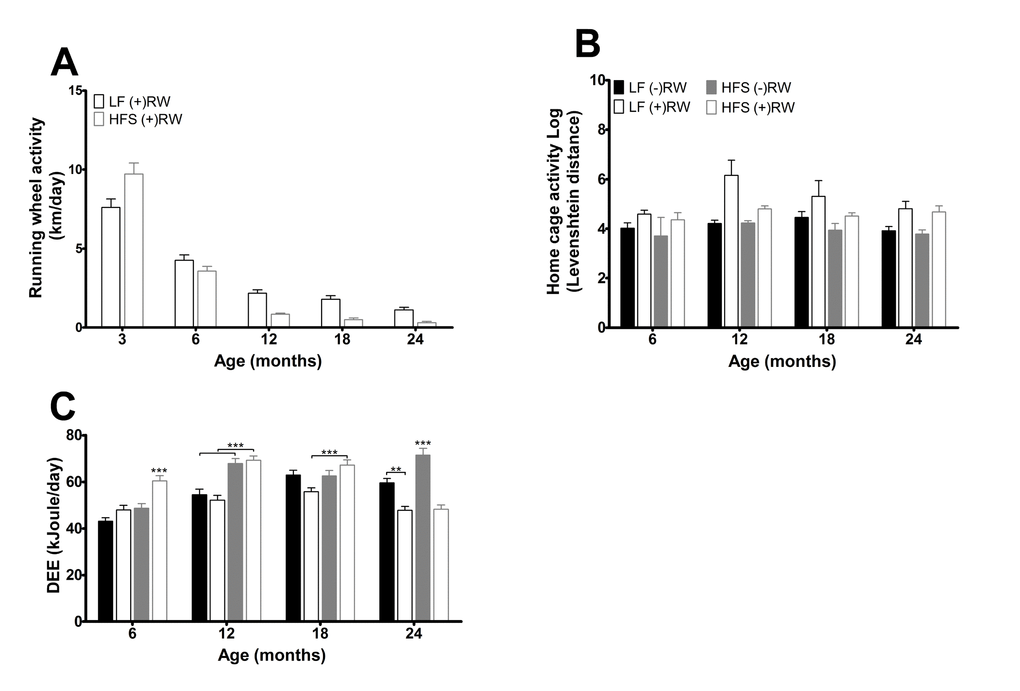
Figure 3.(A) Running wheel activity for the two different running wheel groups at five different time points. Activity was higher in mice on a LF diet (p<0.001) and activity decreased with age (p<0.001). Data are averages from n=15-50 mice per group; ± SEM. (B) Home cage activity for the four different groups at the four different time points. Activity was higher in mice with access to a running wheel (p<0.001) and was higher in mice on a LF diet (p<0.001). Data are averages from n=3-12 mice per group; ± SEM. (C) Daily energy expenditure (DEE) for the four different groups at the four different time points. Data are averages from n=7-8 mice per group; ± SEM **p<0.01, ***p<0.001 per time point analysis (Bonferonni corrected).