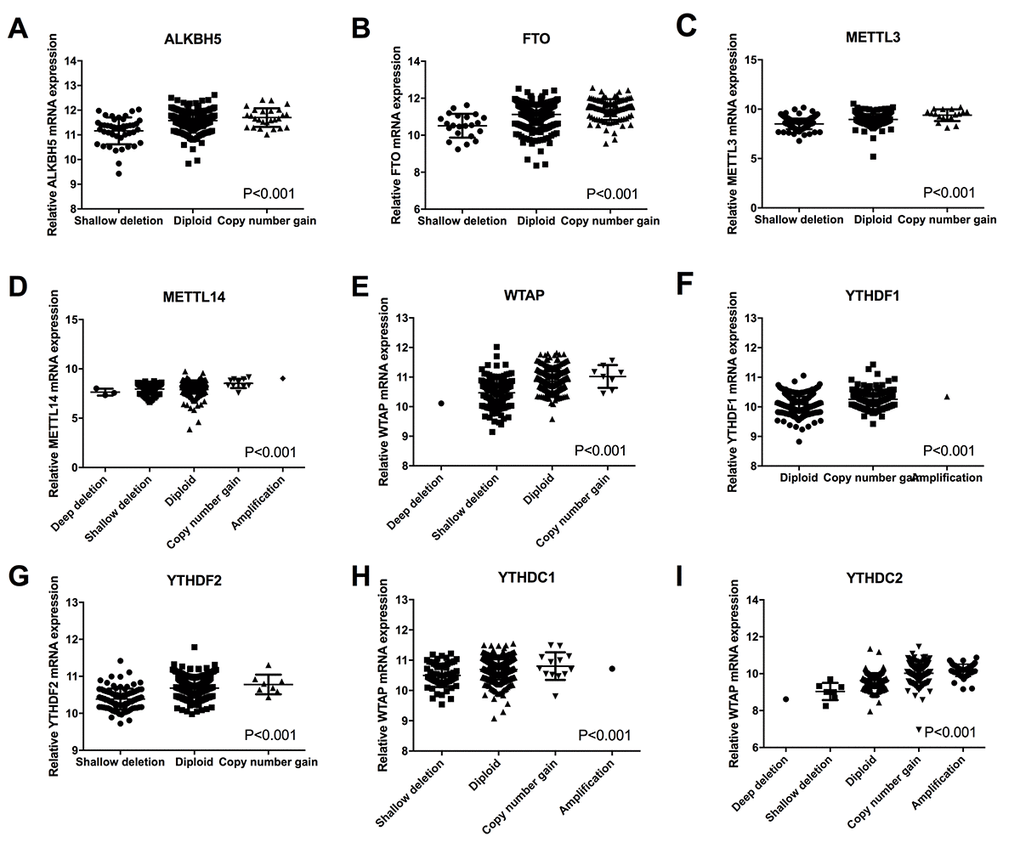
Figure 2.Correlation between different CNV patterns and mRNA expression levels of ten m6A regulatory genes respectively.
Figure 2 — Gene signatures and prognostic values of m6A regulators in clear cell renal cell carcinoma – a retrospective study using TCGA database | Aging