Submit an Article
Navigate
Home
Editorial Board
Editorial Policies
Current Volume
Archive
Scientific Integrity
Publication Ethics Statements
Interviews with Outstanding Authors
Newsroom
Sponsored Conferences
Podcast
Contact
Special Collections
Submit an Article
Online ISSN: 1945-4589
Research Paper
|
Volume 11, Issue 5
|
pp. 1486–1500
Integrated DNA methylation and gene expression analysis in the pathogenesis of coronary artery disease
Back to article
Figure 3
(3 of 8)
−
100%
+
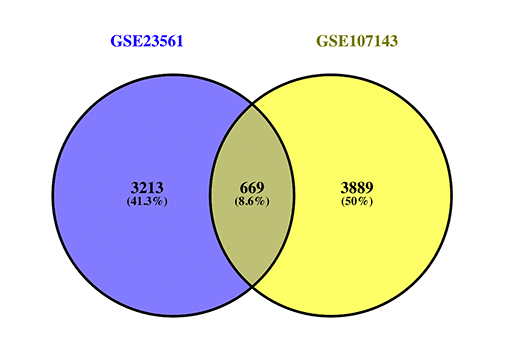
Figure 3.
Venn map showing the intersection of DEGs and DMGs.
Figure 3 — Integrated DNA methylation and gene expression analysis in the pathogenesis of coronary artery disease | Aging