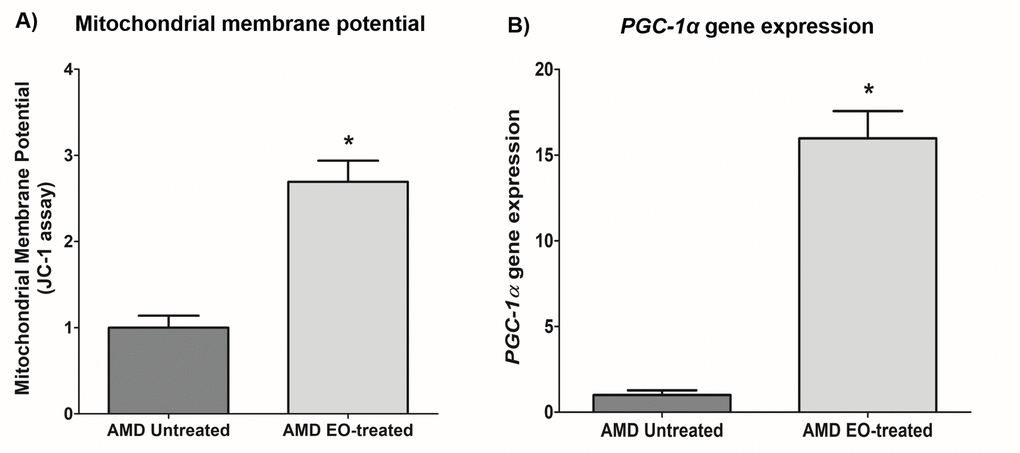
Figure 6.Effect of EO on mitochondrial membrane potential and PGC-1α gene expression. This figure shows increased mitochondrial membrane potential in EO-treated AMD RPE cells (A) and increased PGC-1α gene expression in EO-treated AMD cybrids (B). * indicates p<0.05. Data are presented as mean ± SEM and normalized to untreated AMD cybrids which were assigned a value of 1.