Submit an Article
Navigate
Home
Editorial Board
Editorial Policies
Current Volume
Archive
Scientific Integrity
Publication Ethics Statements
Interviews with Outstanding Authors
Newsroom
Sponsored Conferences
Podcast
Contact
Special Collections
Submit an Article
Online ISSN: 1945-4589
Research Paper
|
Volume 11, Issue 2
|
pp. 649–662
A novel six-microRNA-based model to improve prognosis prediction of breast cancer
Back to article
Figure 1
(1 of 9)
−
100%
+
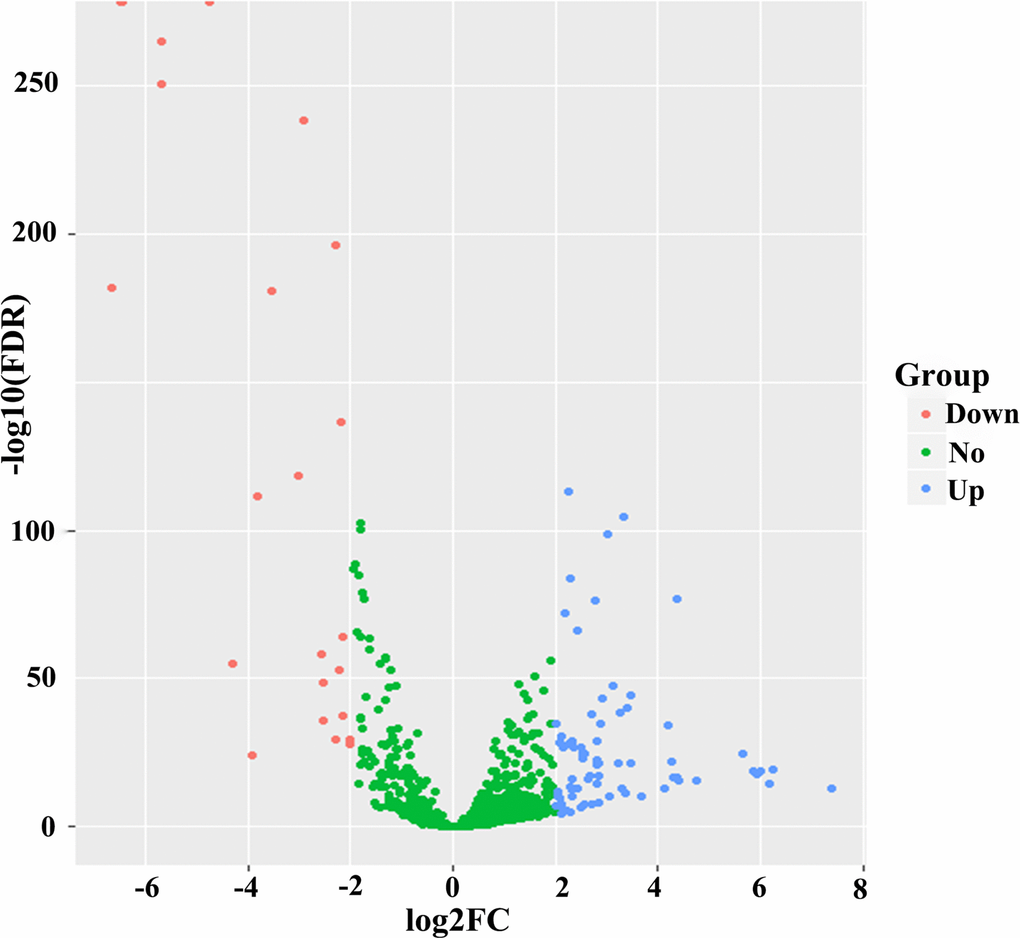
Figure 1.
Volcano plot of 1601 miRNAs in breast cancer patients. Blue color indicates up-regulated expression, and red color represents down-regulated expression.