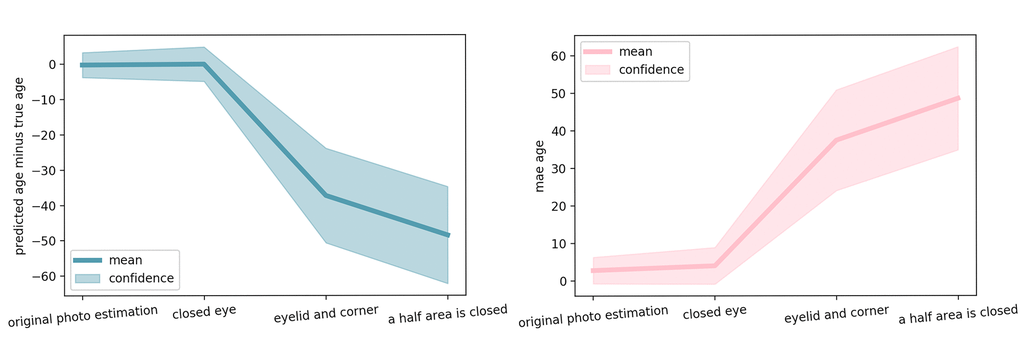
Figure 4.Estimation error for several significant steps of occlusion. Mean and standard deviation of the error over 165 pairs of validation images (left and right eye) is reported.
Figure 4 — PhotoAgeClock: deep learning algorithms for development of non-invasive visual biomarkers of aging | Aging