Submit an Article
Navigate
Home
Editorial Board
Editorial Policies
Current Volume
Archive
Scientific Integrity
Publication Ethics Statements
Interviews with Outstanding Authors
Newsroom
Sponsored Conferences
Podcast
Contact
Special Collections
Submit an Article
Online ISSN: 1945-4589
Research Paper
|
Volume 10, Issue 10
|
pp. 2816–2831
Re-exploring the core genes and modules in the human frontal cortex during chronological aging: insights from network-based analysis of transcriptomic studies
Back to article
Figure 5
(5 of 6)
−
100%
+
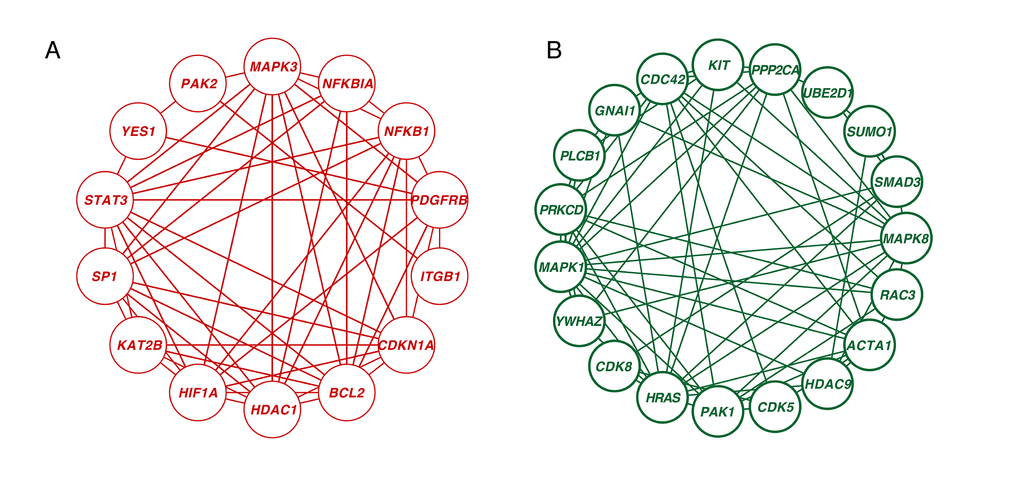
Figure 5.
Network analysis of significantly age-associated genes in the frontal cortex.
(
A
) Zero-order interaction network of upregulated genes (red). (
B
) Zero-order interaction network of downregulated genes (green).