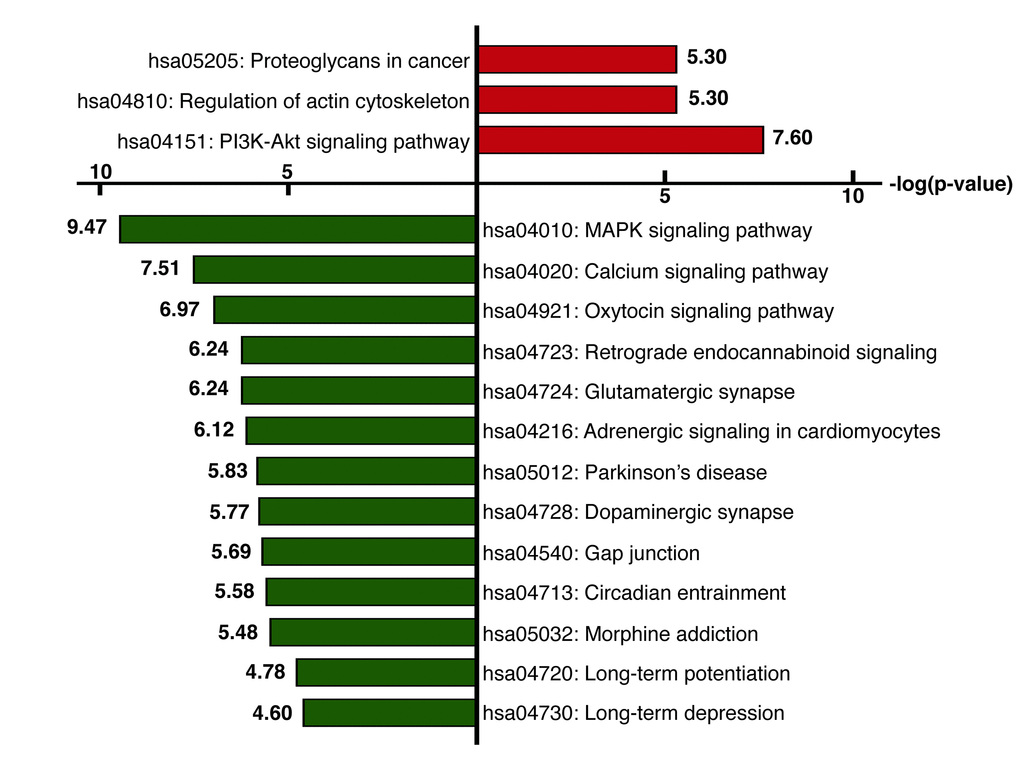
Figure 3.KEGG pathway analysis. KEGG pathway analysis was performed using the set of genes showing upregulated (red) or downregulated (green) expression (FDR< 0.05). The x-axis represents the fold enrichment (indicating the magnitude of enrichment in our dataset against the population background based on analysis using DAVID bioinformatics tools). The y-axis shows the pathway categories.