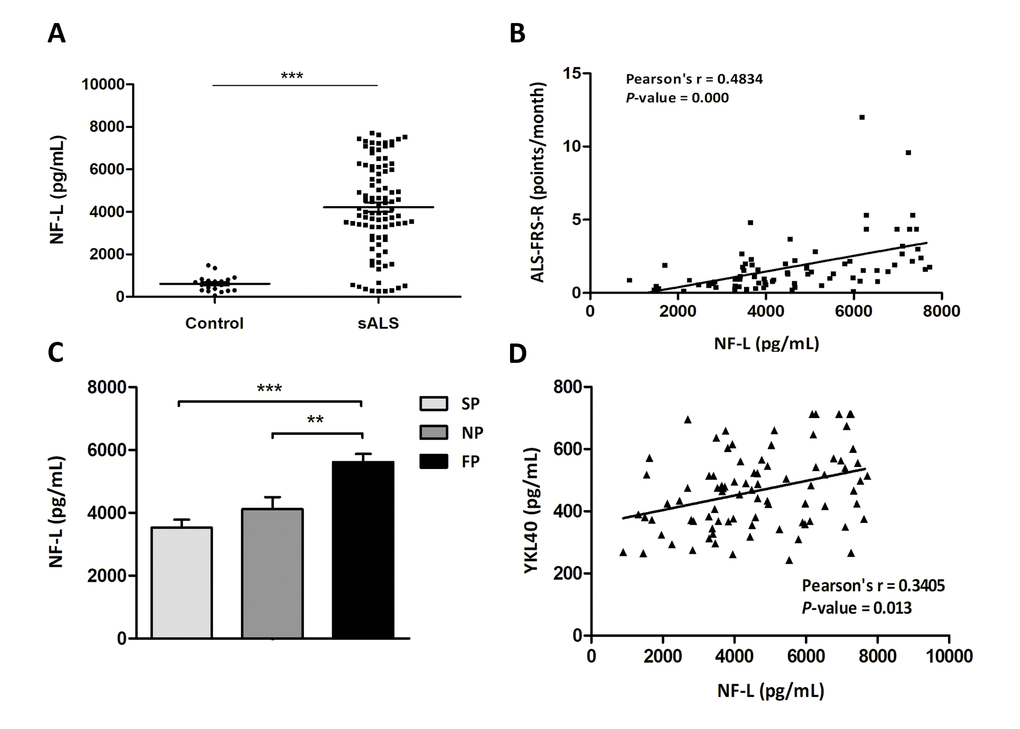
Figure 3.(A) Quantification of NF-L protein levels in the CSF in sALS (n=85) and control (n=23) cases. (B) Positive correlation between ALS-FRS-R slope (point/month) and NF-L levels (pg/mL) (Pearson’s correlation, P=0.000). (C) Higher NF-L protein levels in the CSF are found in cases with fast progression (FP) when compared with cases with slow and normal progression (SP and NP, respectively; P = 0.000, P = 0.005). (D) Positive correlation between YKL40 levels (pg/mL) and NF-L levels (pg/mL) (Pearson’s correlation, P=0.013).