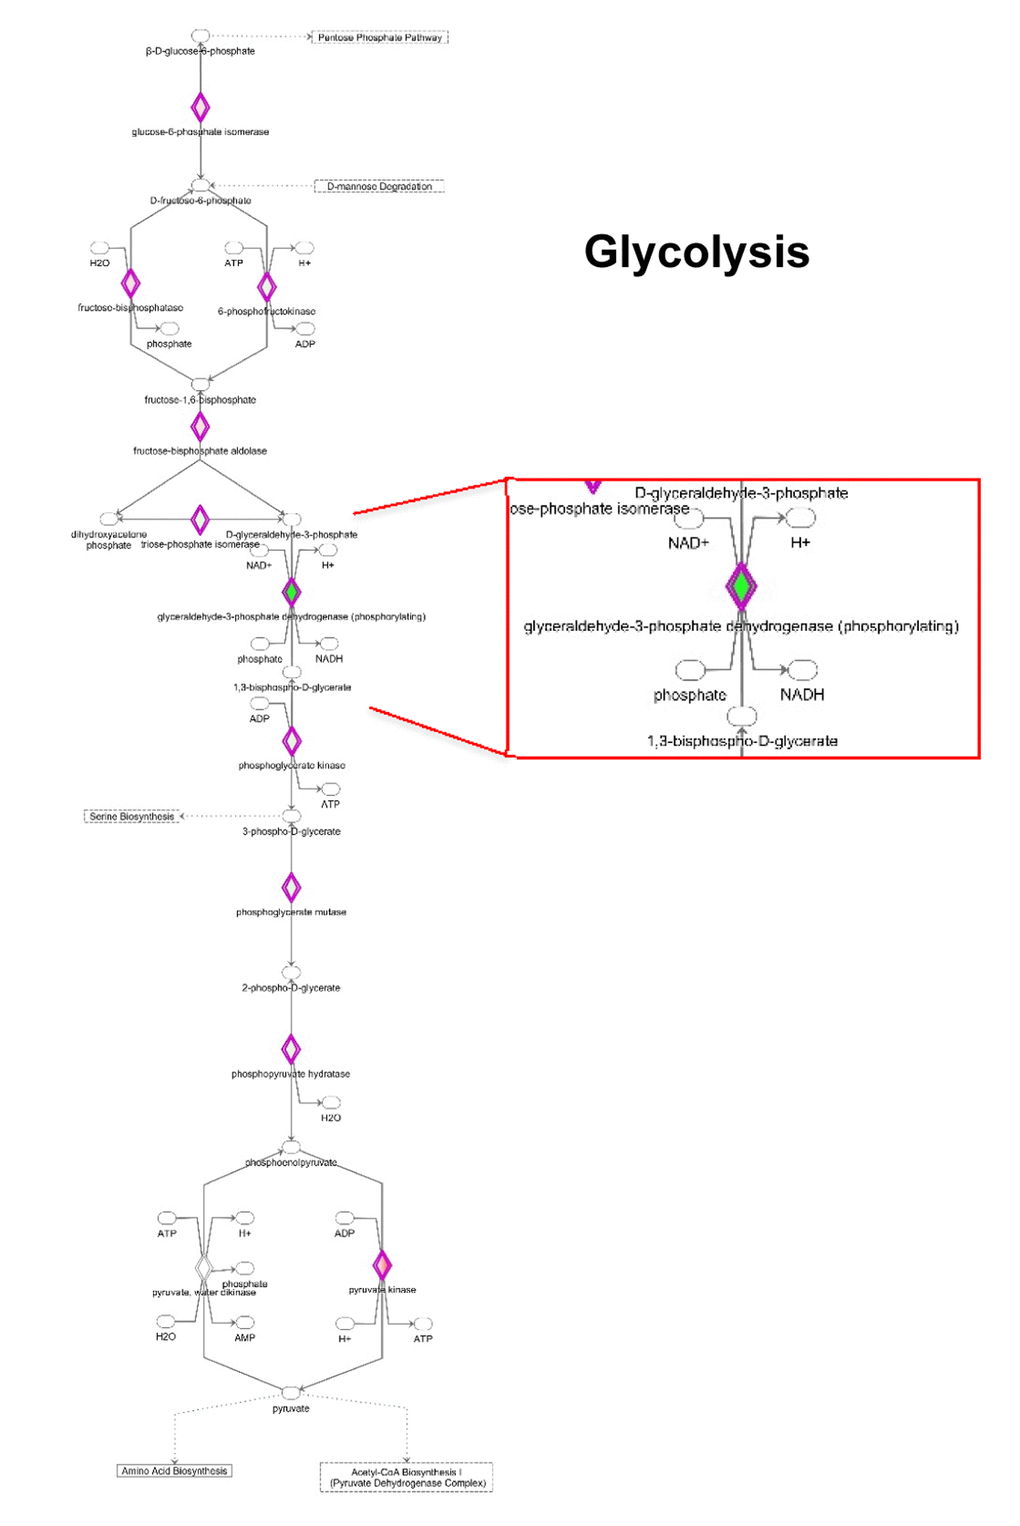
Figure 8.Modifications in the expression of glycolytic enzymes. Schematic representation of glucose metabolism upon MGT treatment. Green tea exposure causes an evident impairment of glycolytic pathway. Proteins down-regulated (in green) or up-regulated (in red) are shown.