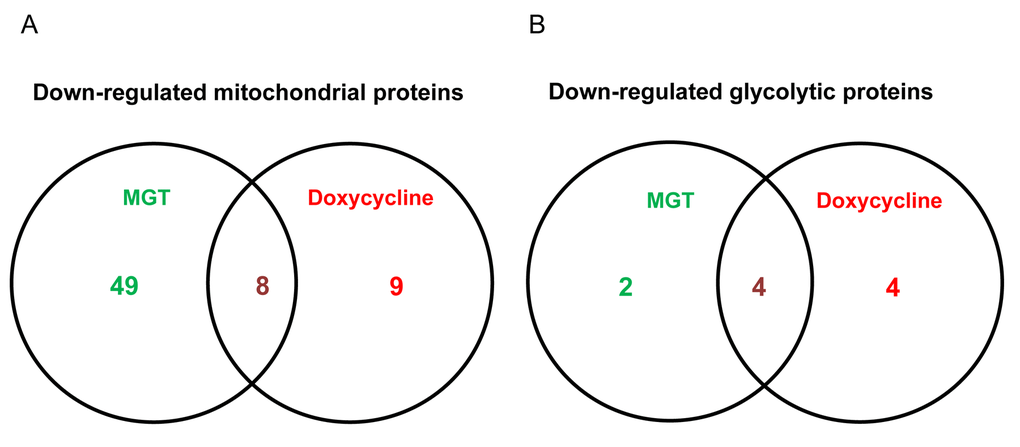
Figure 4.Venn diagram of proteomics data of MGT-treated MCF7 cells versus doxycycline-treated MCF7 cells. Proteomic analysis validates the metabolic effects of MGT on breast cancer cells. (A) Venn diagram of mitochondrial down-regulated proteins in MGT-treated cells versus doxycycline-treated cells. Note that, among the mitochondrial down-regulated proteins by the two treatments, eight are commonly down-regulated. (B) Venn diagram of glycolytic down-regulated proteins in MGT-treated cells versus doxycycline-treated cells. Note that the two different treatments down-regulated several glycolytic proteins and four of those were in common among the two.