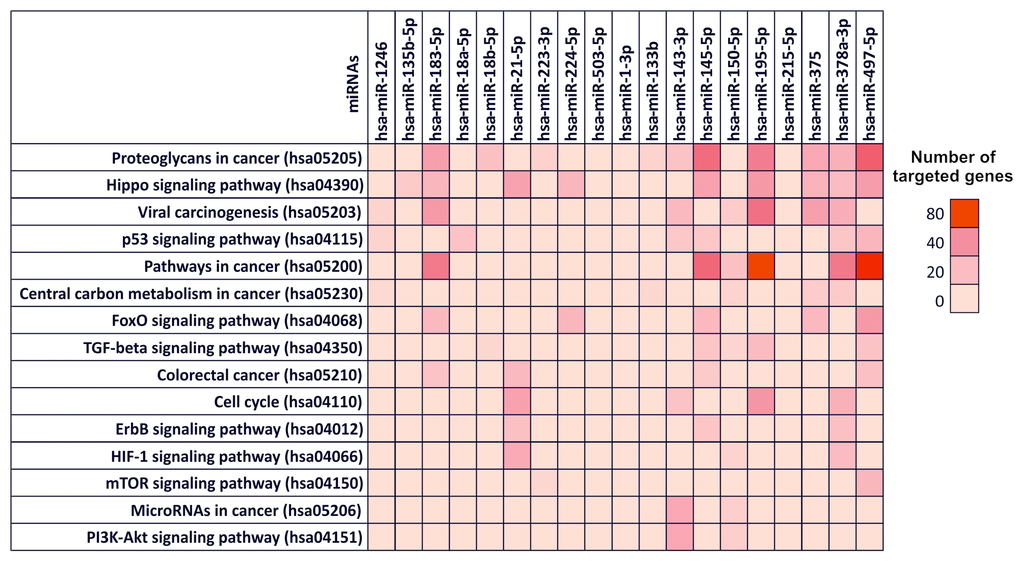
Figure 4.Diana-mirPath pathway analysis – Interaction between selected miRNAs and several molecular pathways involved in cancer development. Prediction pathway analysis of the interaction between individually selected miRNAs and the molecular and signaling pathways involved in CRC development. For each miRNA is indicated the number of targeted gene within a specific pathway by highlighting the corresponding box with a color scale ranging from red (80 genes targeted) to light red (0 genes targeted).