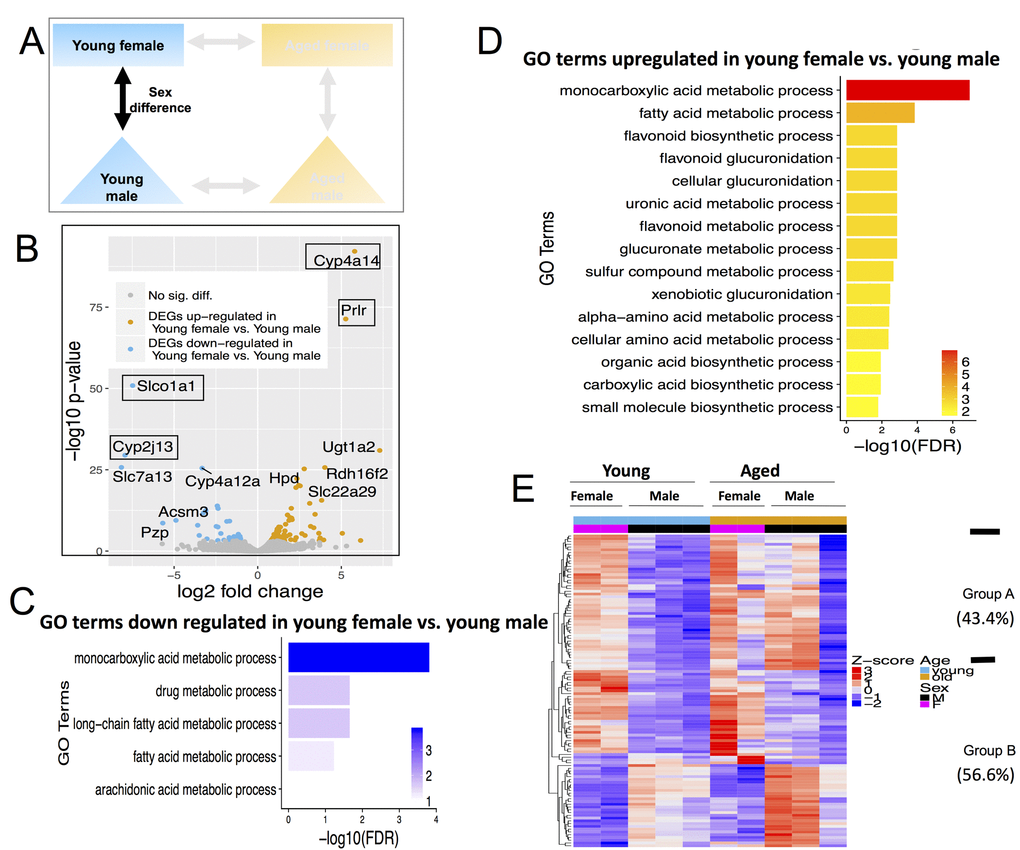
Figure 5.Differentially expressed genes (DEGs) and pathways in young female vs. young male. (A) Comparisons made included age with female and male-centric views. (B) Volcano plot showing up-regulated (mustard) and down-regulated (blue) DEGs, and those not significant (grey). Text boxes highlight individual genes discussed in results section. (C) Gene ontology (GO) terms significantly enriched in genes up-regulated in young female vs. young male mice. (D) GO terms significantly enriched in genes down-regulated in young female vs. young male mice. (E) Expression pattern of young female vs. young male DEGs across all age and sex conditions. Group A genes (43.4% of all DEGs) are decreased with age; Group B genes (56.6%) either persisted or increased with age.