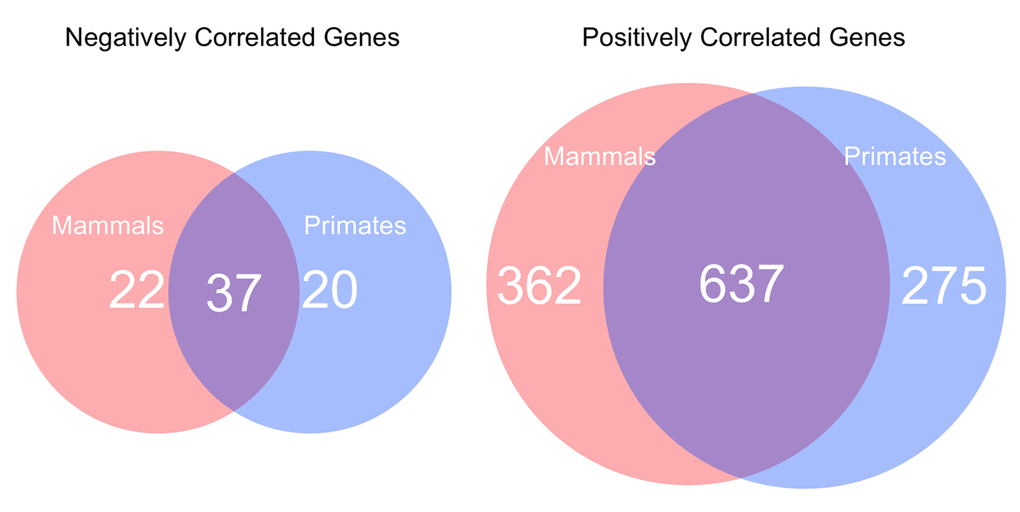
Figure 5.The number of negatively and positively correlated lifespan-related genes in the whole mammalian dataset compared to those specific to primates. Negatively correlated genes and positively correlated genes.
Figure 5 — The evolution of CpG density and lifespan in conserved primate and mammalian promoters | Aging