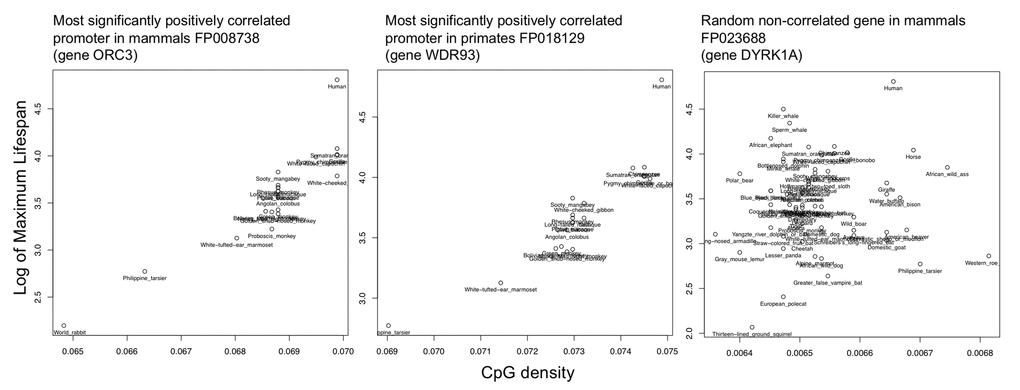
Figure 3.Example correlations of top hit and random promoter. Shown are the scatterplots of the log(max lifespan) vs. CpG density values for the most significantly correlated promoters from each of the mammalian and primate datasets as compared to a random non-correlated gene.