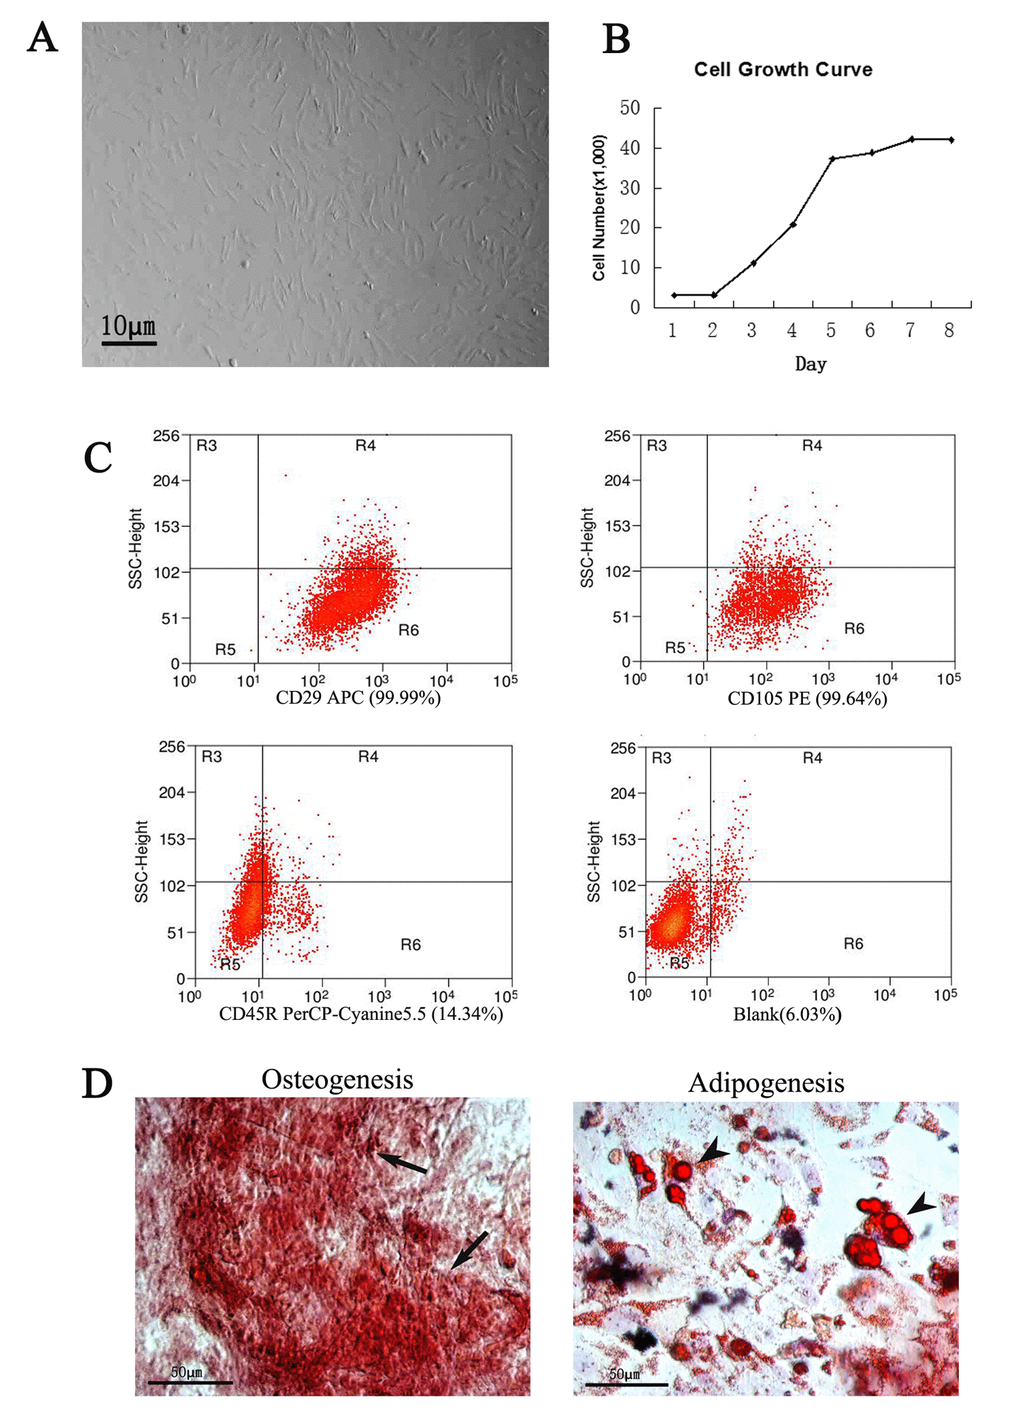
Figure 1.Culture and identification of ADSCs. The ADSCs exhibited typical fibroblastic morphology (A) and normal cell growth curve (B), bar=10μm. (C) Flow cytometric analysis of ADSCs. Compared to the positive rate of blank control group (6.03%), the cells were positive expression of CD29 (99.99%), CD105 (99.64%) and negative expression of CD45R (14. 34%). (D) Identification of ADSCs through osteogenesis and adipogenesis. The ADSCs differentiate into osteoblasts and adipocytes. Arrows indicate osteoblasts, arrowheads indicate adipocytes.