Submit an Article
Navigate
Home
Editorial Board
Editorial Policies
Current Volume
Archive
Scientific Integrity
Publication Ethics Statements
Interviews with Outstanding Authors
Newsroom
Sponsored Conferences
Podcast
Contact
Special Collections
Submit an Article
Online ISSN: 1945-4589
Research Paper
|
Volume 9, Issue 11
|
pp. 2334–2351
Expression of a novel CNPY2 isoform in colorectal cancer and its association with oncologic prognosis
Back to article
Figure 5
(5 of 5)
−
100%
+
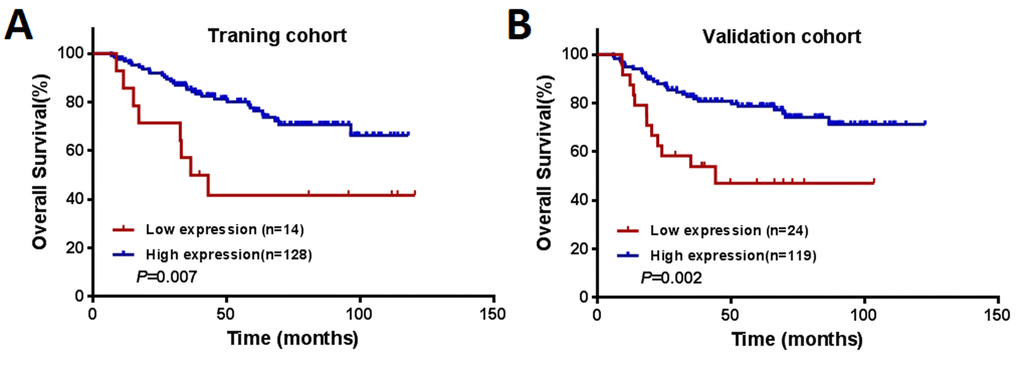
Figure 5.
Kaplan–Meier curves of OS among patients with colorectal cancer.
(
A
) The training cohort (
n
= 142). (
B
) The validation cohort (
n
= 143).
Figure 5 — Expression of a novel CNPY2 isoform in colorectal cancer and its association with oncologic prognosis | Aging