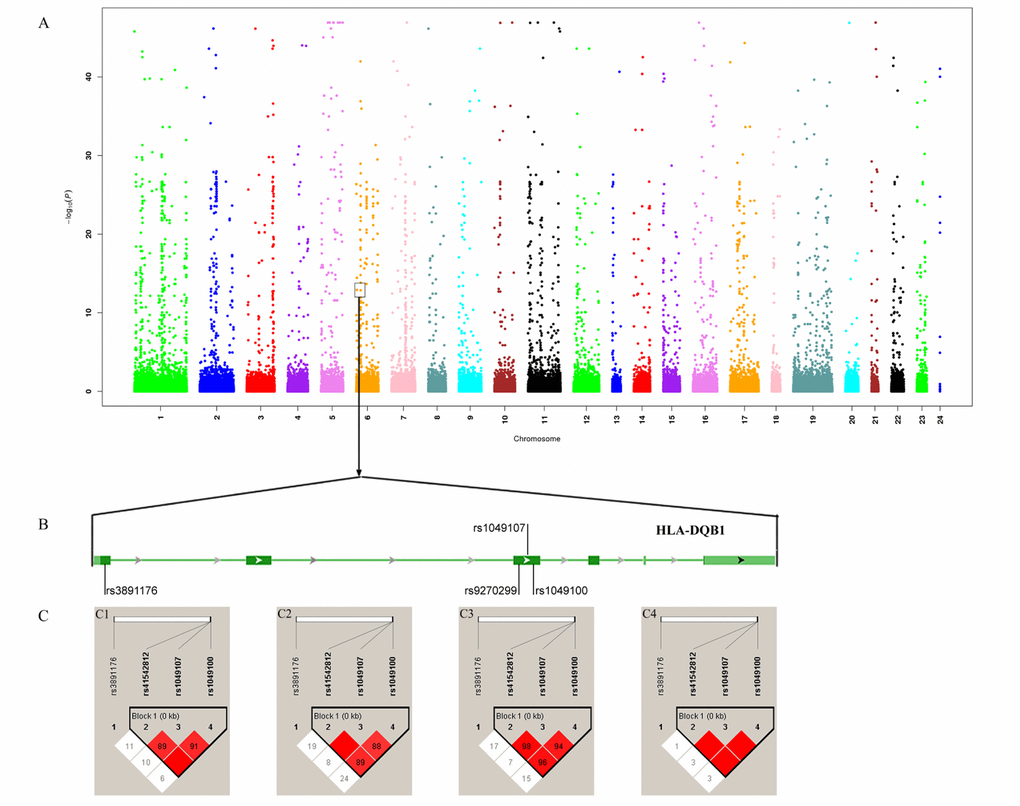
Figure 2.Association analysis identified HLA-DQB1 as longevity-associated gene. (A) Manhattan map of whole-exome sequencing; (B) Four variants in HLA-DQB1; (C) Linkage disequilibrium analysis of four variants. C1 LD map of centenarians; C1 LD map of nonagenarians; C3: LD map of longevity; C4: LD map of controls.