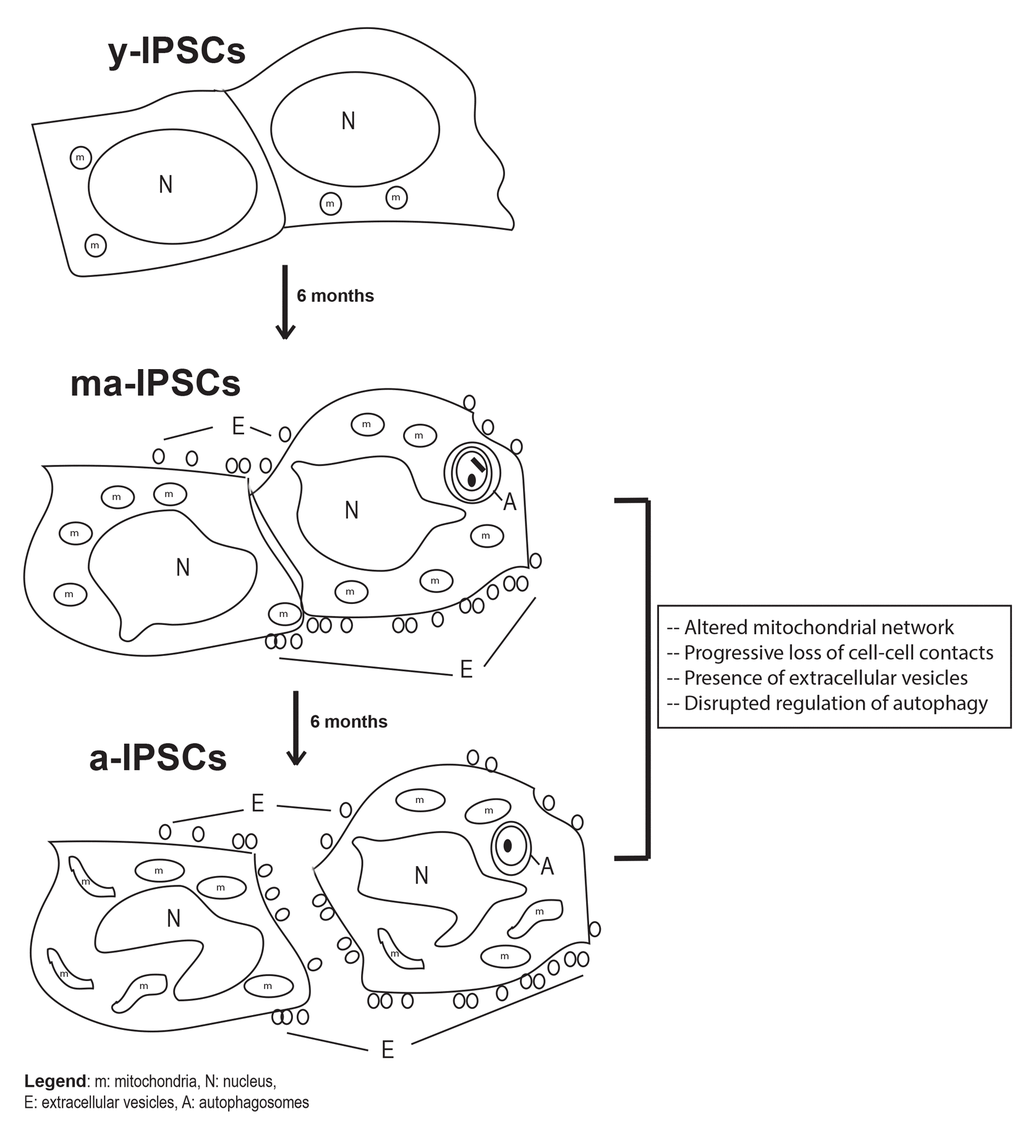
Figure 9.Schematic diagram of biological features observed in y-iPSCs, ma- (following 6 months of culture) and a-iPSCs (In particular, we highlighted the mitochondrial disruption, the progressive loss of cell- cell contacts, the presence of autophagosomes and extracellular vesicles with aging. m, mitochondria; N, nucleus; E, extracellular vesicles; A, autophagosomes.