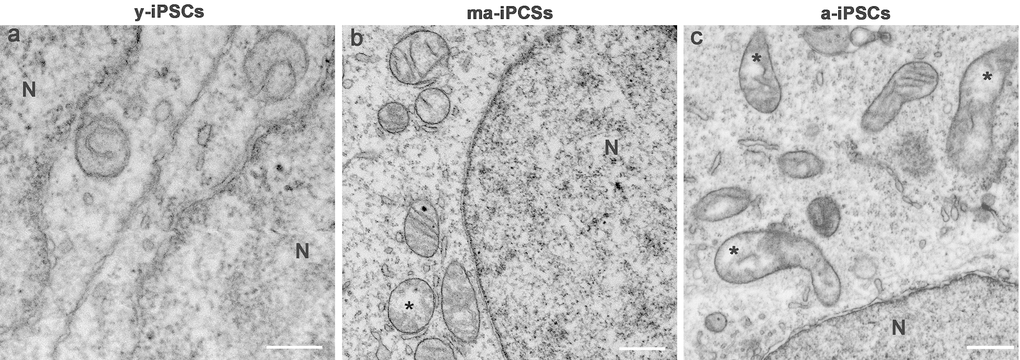
Figure 3.FIB/SEM micrographs of y-, ma- and a-iPSCs showing changes in mitochondrial structure during culturing time. Mitochondria with disorganized cristae are indicated by the asterisks in ma- and a-iPSCs. N, nuclei Scale bars, 1μm.
Figure 3 — Senescence-associated ultrastructural features of long-term cultures of induced pluripotent stem cells (iPSCs) | Aging