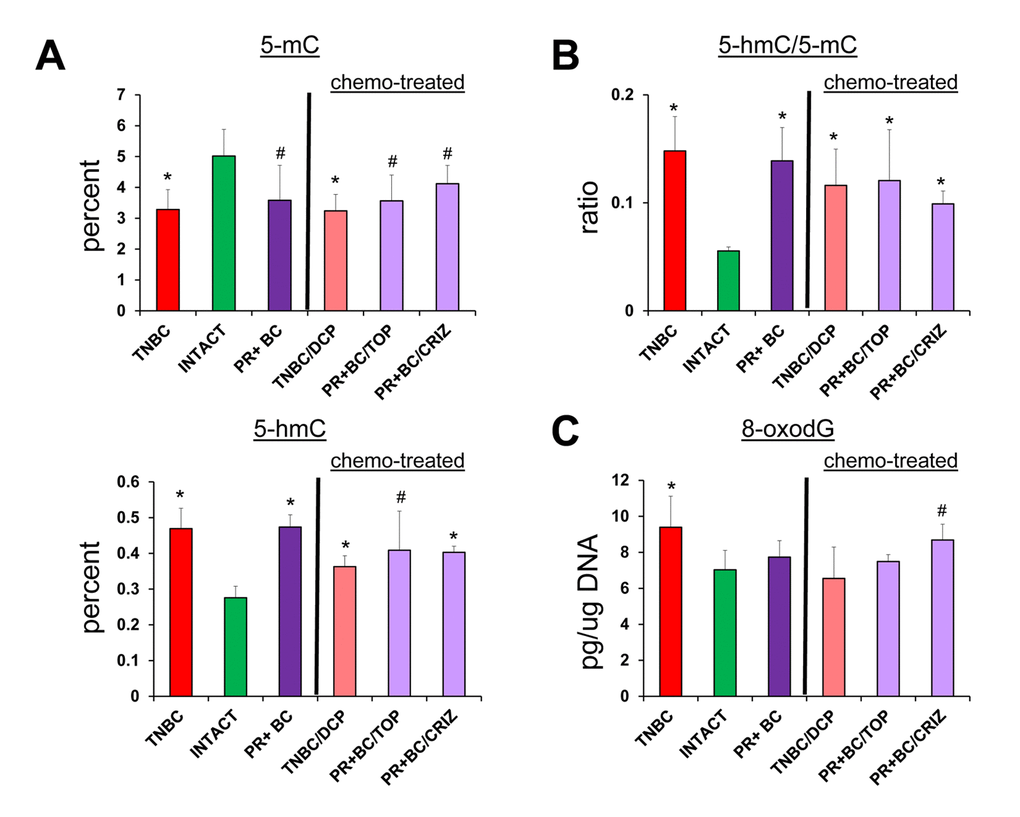
Figure 5.Tumor vs. chemo brain – levels of 8-oxodG, 5-mC and 5-hmC, and ratio of 5-hmC/5-mC in genomic DNA isolated from the PFC tissues of TNBC and PR+BC-bearing chemotherapy treated and untreated TumorGraft mice. Significantly different from control mice -* p<0.05, # p<0.10, Student's t-test.