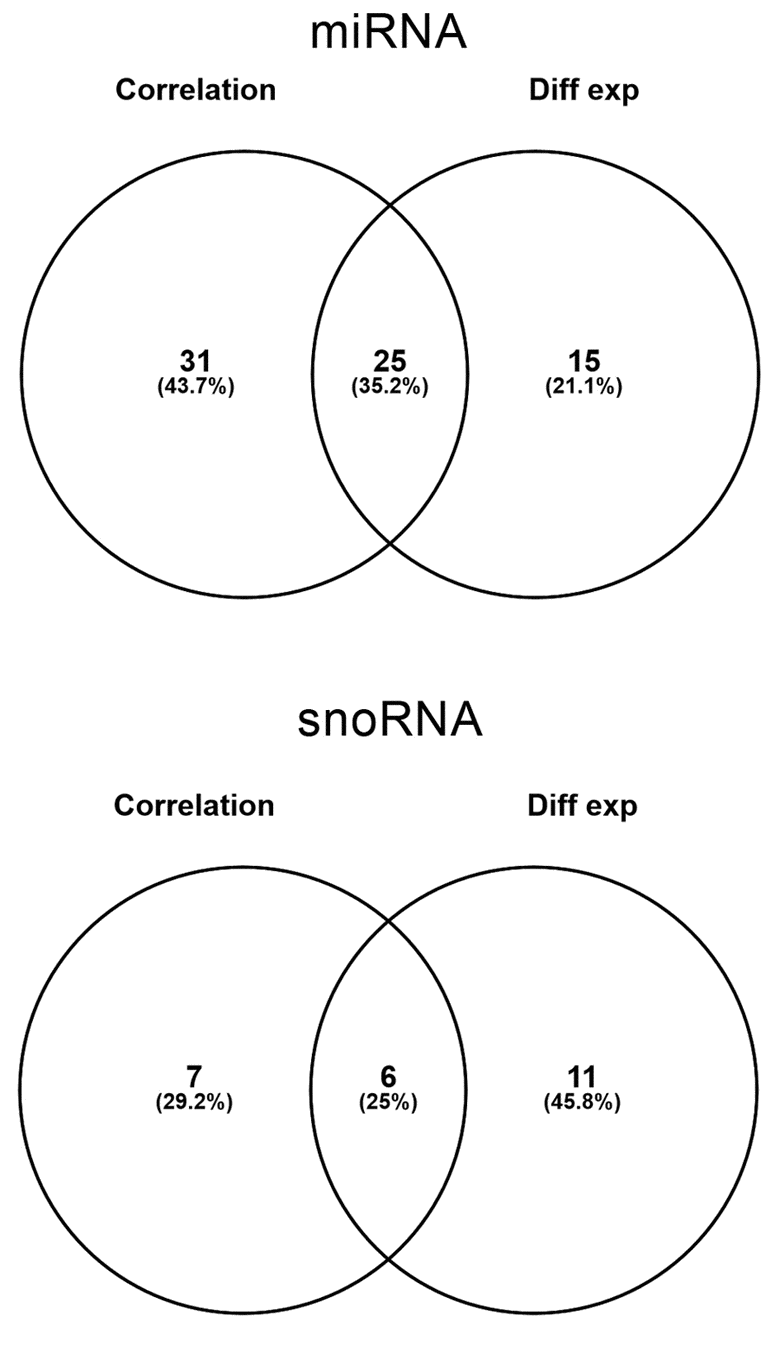
Figure 3.Number of miRNA (top) and snoRNA (bottom) identified by correlation and differential expression analysis and the overlapping probes between two analyses.
Figure 3 — Progressive changes in non-coding RNA profile in leucocytes with age | Aging