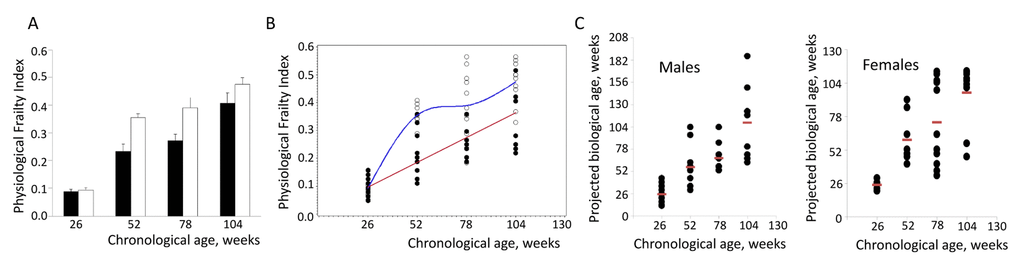
Figure 1.Assessment of individual biological age of NIH Swiss mice. (A) Age-related increase in PFI in male (closed bars) and female (open bars) NIH Swiss mice (n=10-12/group). PFI indices were measured as described using 16 or 18 parameters for males and females respectively. Data is presented as mean +SEM. One-way ANOVA detects significant effect of age on FI value (p<0.001 for both sexes). (B) PFI values for individual male (closed circles) and female (open circles) mice. A cubic regression performed on this set of data generated the best fitting model as: PFI=0.00684+0.0034×BA for males (red line) and PFI=-0.67372+0.04277×CA-0.00057899×CA2+0.00000263×CA3 for females (blue line). All regression coefficients presented were significantly different from 0 at the 0.05 alpha-level. (C) Projected biological age of individual mice calculated from the PFI values using the fitting model predictions..