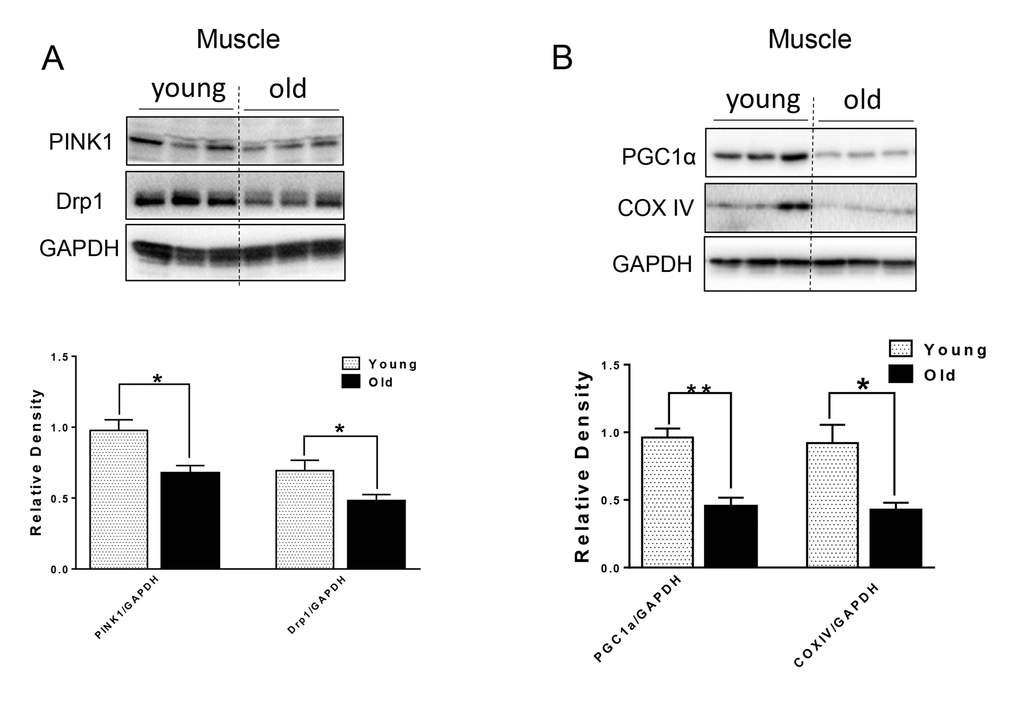
Figure 4.The protein level of mitochondrial quality control markers in young and old skeletal muscle. (A) Immunoblot and densitometric analysis of PINK1 and Drp1. (B) Immunoblot and densitometric analysis of PGC1 α and COXIV. Values are means±SEM for 6 young and 5 old mice in each group. *P < 0.05. **P < 0.01.