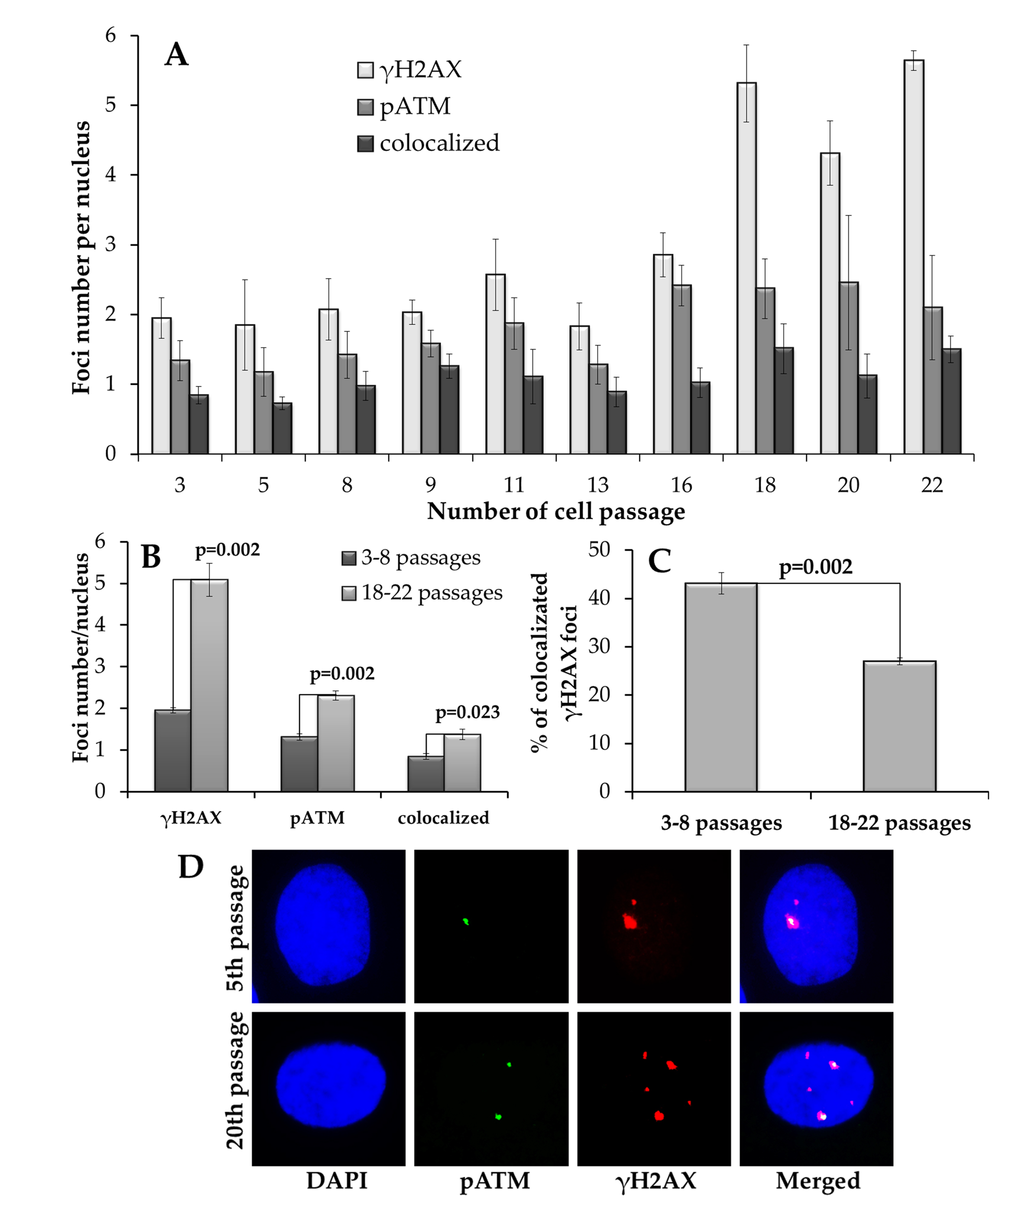
Figure 1.Immunocytochemical analysis of γH2AX and pATM foci. (A) Changes in γH2AX, pATM foci and their co-localization depending on the passage number in MSCs. (B) Comparative analysis of γH2AX, pATM foci and their co-localization in early (3-8) vs. late (18-22) passages of MSCs. (C) Fraction of γH2AX foci that co-localize with pATM at early (3-8) vs. late (18-22) passages of MSCs. (D) Representative immunofluorescent microphotographs of MSC showing γH2AX (green), pATM (red) foci and their co-localization (yellow) at passage 5 and 20. Nuclei were counterstained with DAPI.