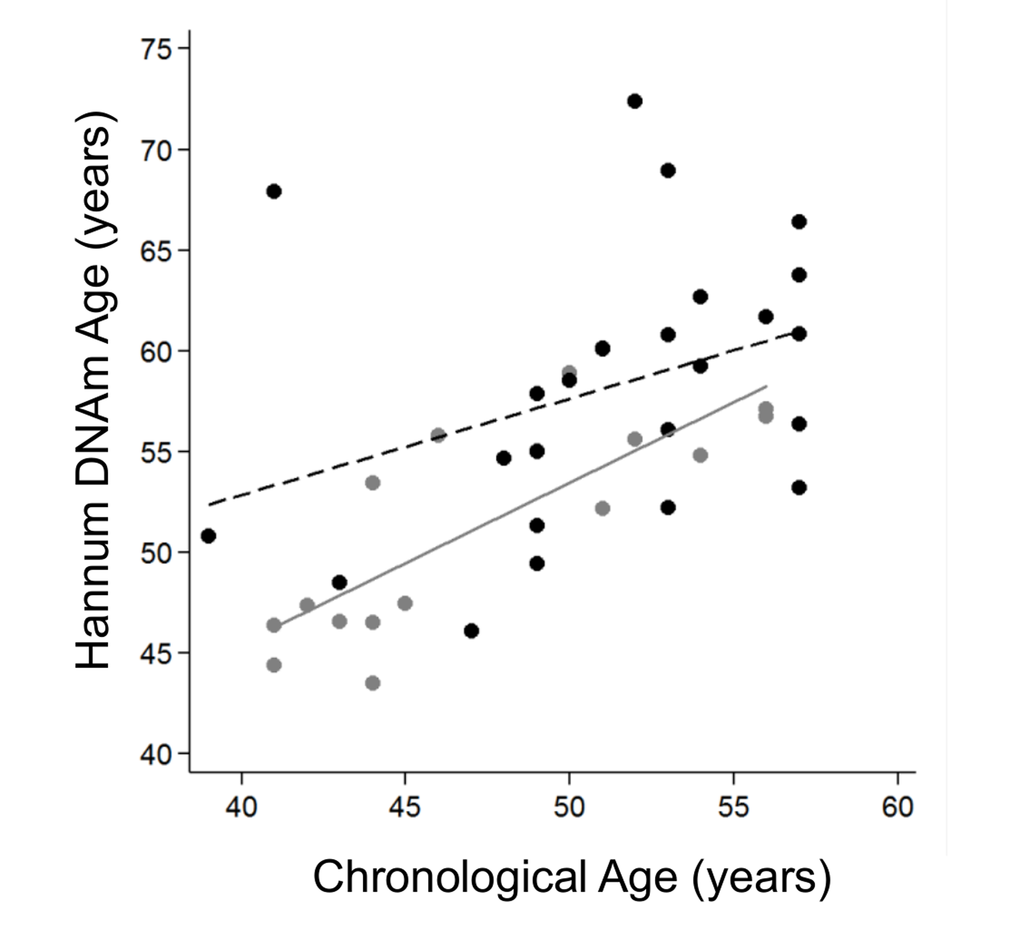
Figure 3.Hannum DNA methylation Age versus chronological age of younger adults (≤57 years old). Grey and black circles in the scatterplot denote samples from controls and cases, respectively. The grey line represents a linear regression line through control samples. The black dashed line represents a linear regression line through IS cases, OR=1.13 (95%CI 1.03-1.23), p-value 0.01.