Submit an Article
Navigate
Home
Editorial Board
Editorial Policies
Current Volume
Archive
Scientific Integrity
Publication Ethics Statements
Interviews with Outstanding Authors
Newsroom
Sponsored Conferences
Podcast
Contact
Special Collections
Submit an Article
Online ISSN: 1945-4589
Research Paper
|
Volume 8, Issue 11
|
pp. 2655–2666
Ischemic stroke patients are biologically older than their chronological age
Back to article
Figure 1
(1 of 3)
−
100%
+
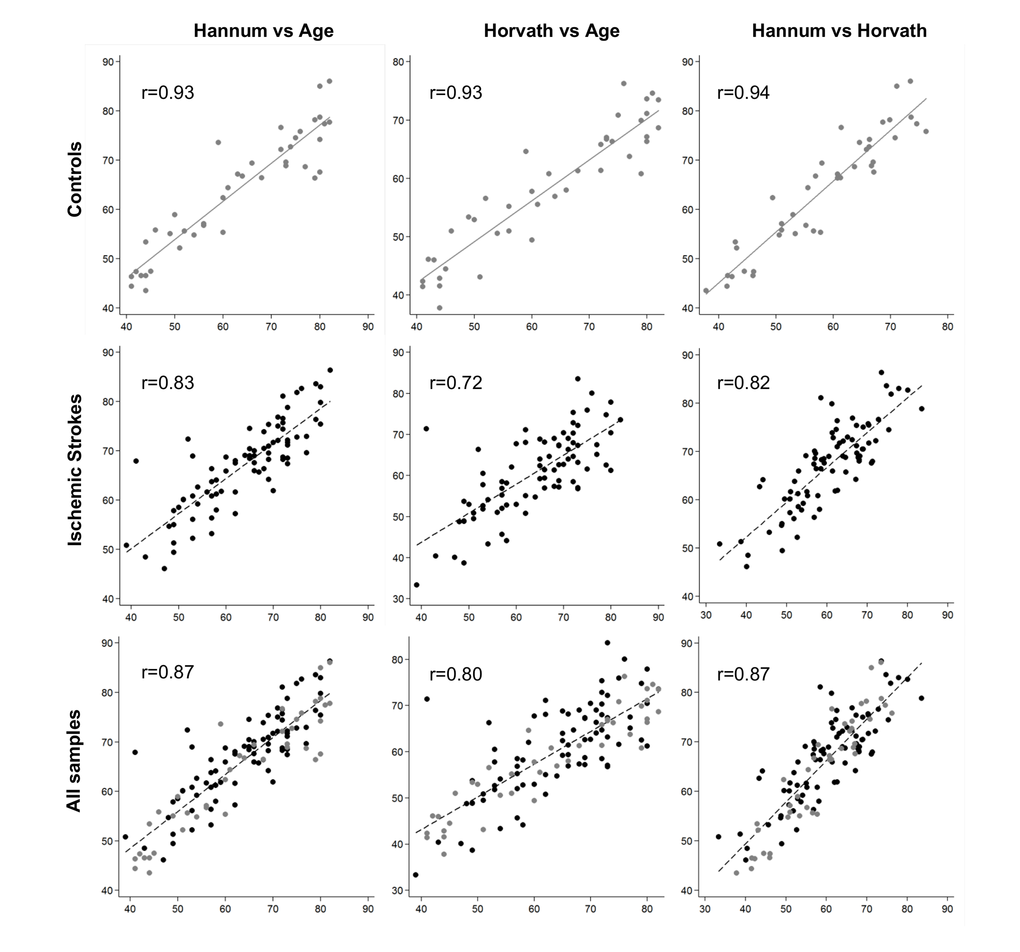
Figure 1.
Plots of predicted methylation age (Hannum and Horvath) against chronological age and plots of Hannum versus Horvath predicted methylation age. r, Pearson correlation.