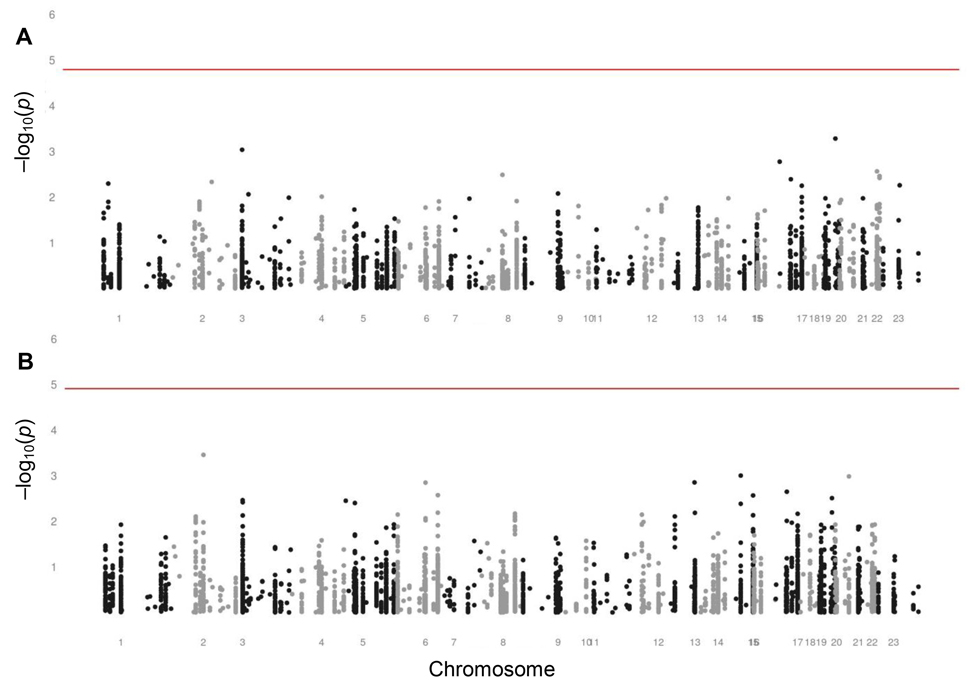
Figure 3.Manhattan plots assessing the associations of SNPs with fertility in women(A) Manhattan plot assessing the associations of SNPs with observed fertility in middle-aged women of fertile ages from 20 through 44 years. The level of significance is 1.61 × 10⁻⁵, indicated by the red line. (B) Manhattan plot assessing the associations of SNPs with reported fertility in postmenopausal women aged 45 years and older. The level of significance is 1.23 × 10⁻⁵, indicated by the red line.