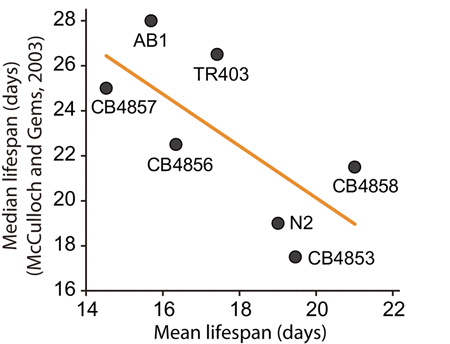
Figure 4.Correlation analysis between lifespan results in previous study (McCulloch and Gems, 2003) and that in this studyShown are mean lifespans (this study) and median lifespans (McCulloch and Gems, 2003) of seven wild C. elegans strains that were used in both studies. The lifespans negatively correlated with each other (r = 0.686), although the correlation is not significant (p = 0.089) perhaps because of small n (n=7). Orange line indicates a linear regression line. Please see Discussion for detailed description.