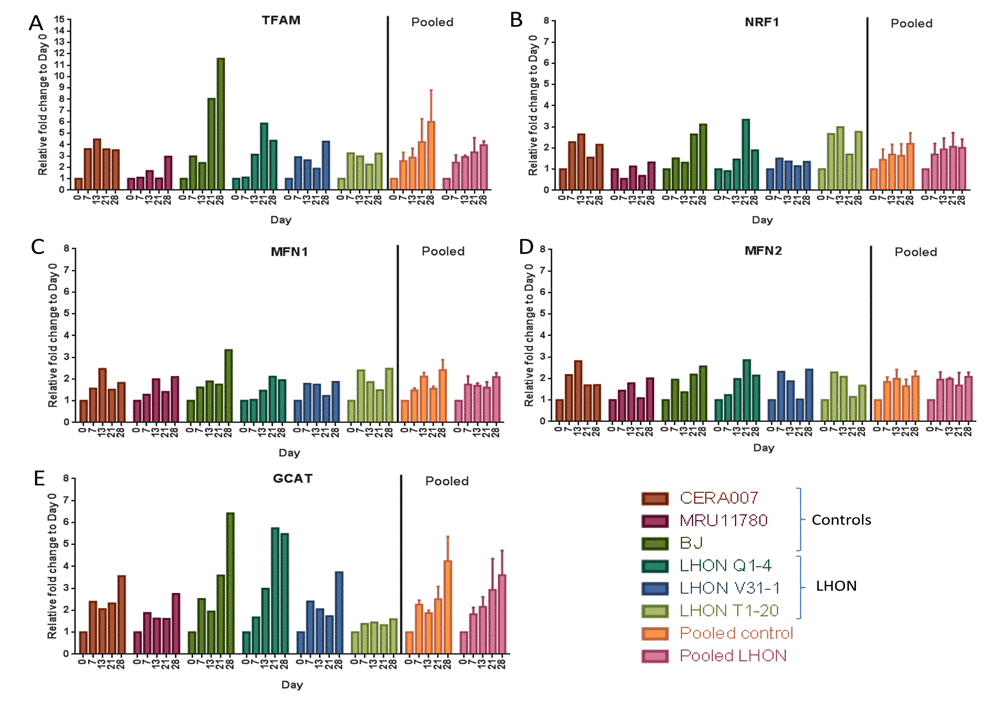
Figure 5.Expression of mitochondrial regulatory genes during reprogrammingqPCR analysis of the expression of (A) TFAM, (B) NRF1, (C) MRN1, (D) MFN2 and (E) GCAT at various time points during reprogramming to hiPSCs (day 0, 7, 13, 21, 28). Error bars represent SEM for pooled data of control (CERA007, MRU11780, BJ) or LHON (LHON Q1-4, LHON V31-1, LHON T1-20).