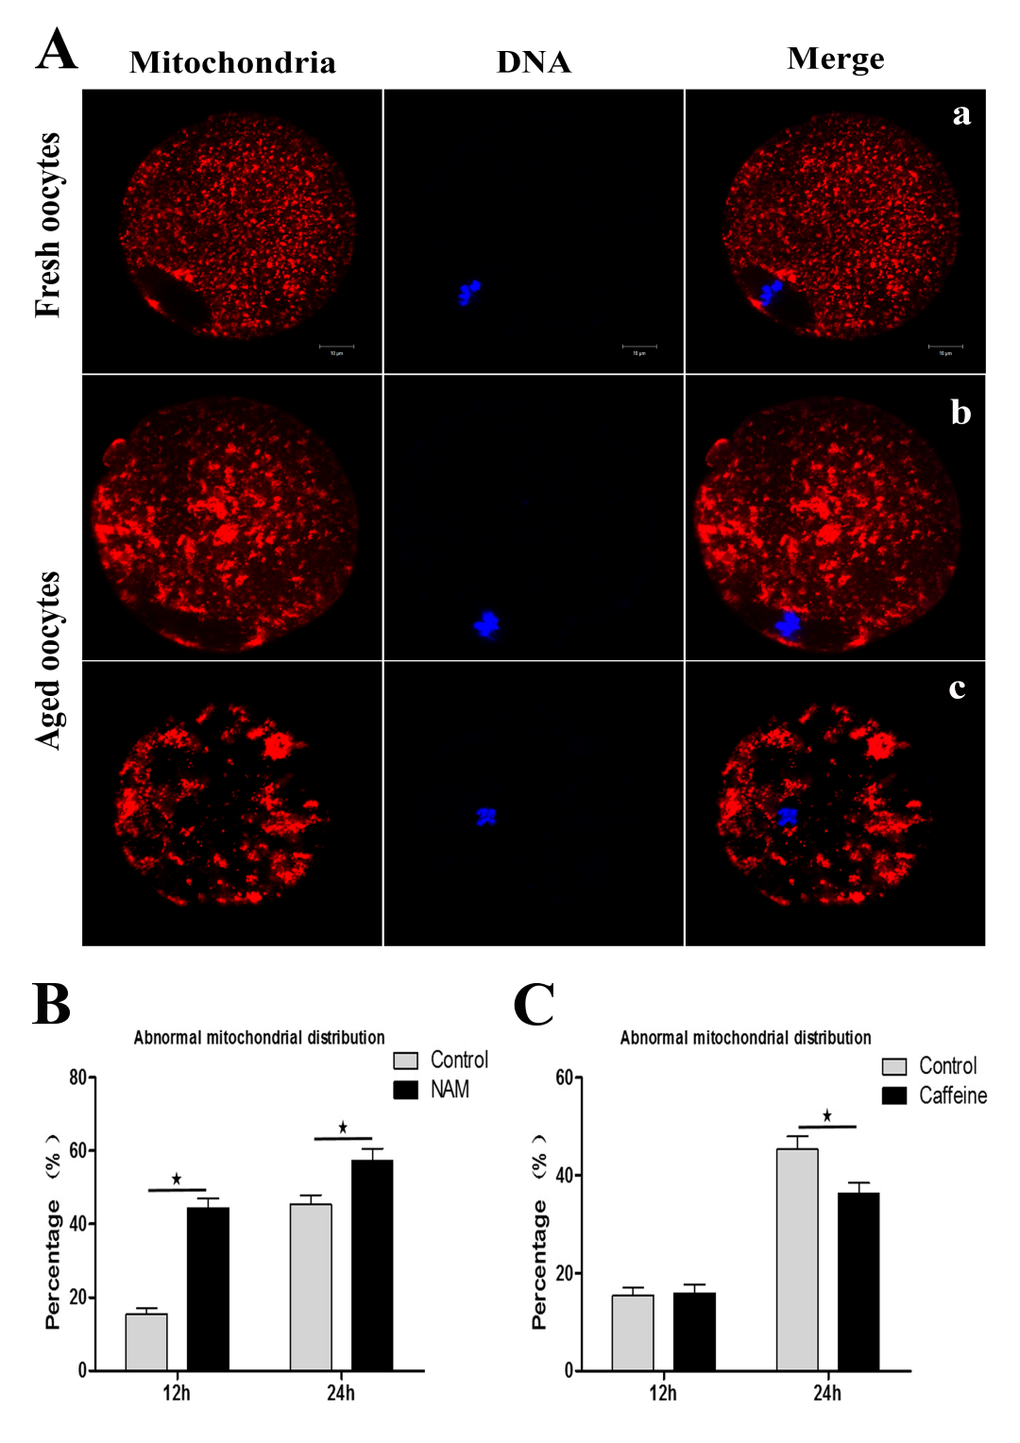
Figure 4.SIRT1, 2, 3 affect mitochondrial distribution during aging of MII oocytes(Aa) Distribution of mitochondria in fresh MII oocytes. (Ab; Ac) Distribution of mitochondrial in aged oocytes. DNA (blue); mitochondria (red). Scale bars: 10 μm. (B) At 12 h or 24h of MII oocyte aging, the proportion of the abnormal distribution pattern in control oocytes or NAM-treated oocytes, respectively. (C) The proportion of abnormal mitochondrial morphology in control oocytes or caffeine-treated oocytes at 12h and 24h of aging, respectively. Data are expressed as mean ± SEM of at least 3 independent experiments. *Significantly different (P < 0.05).