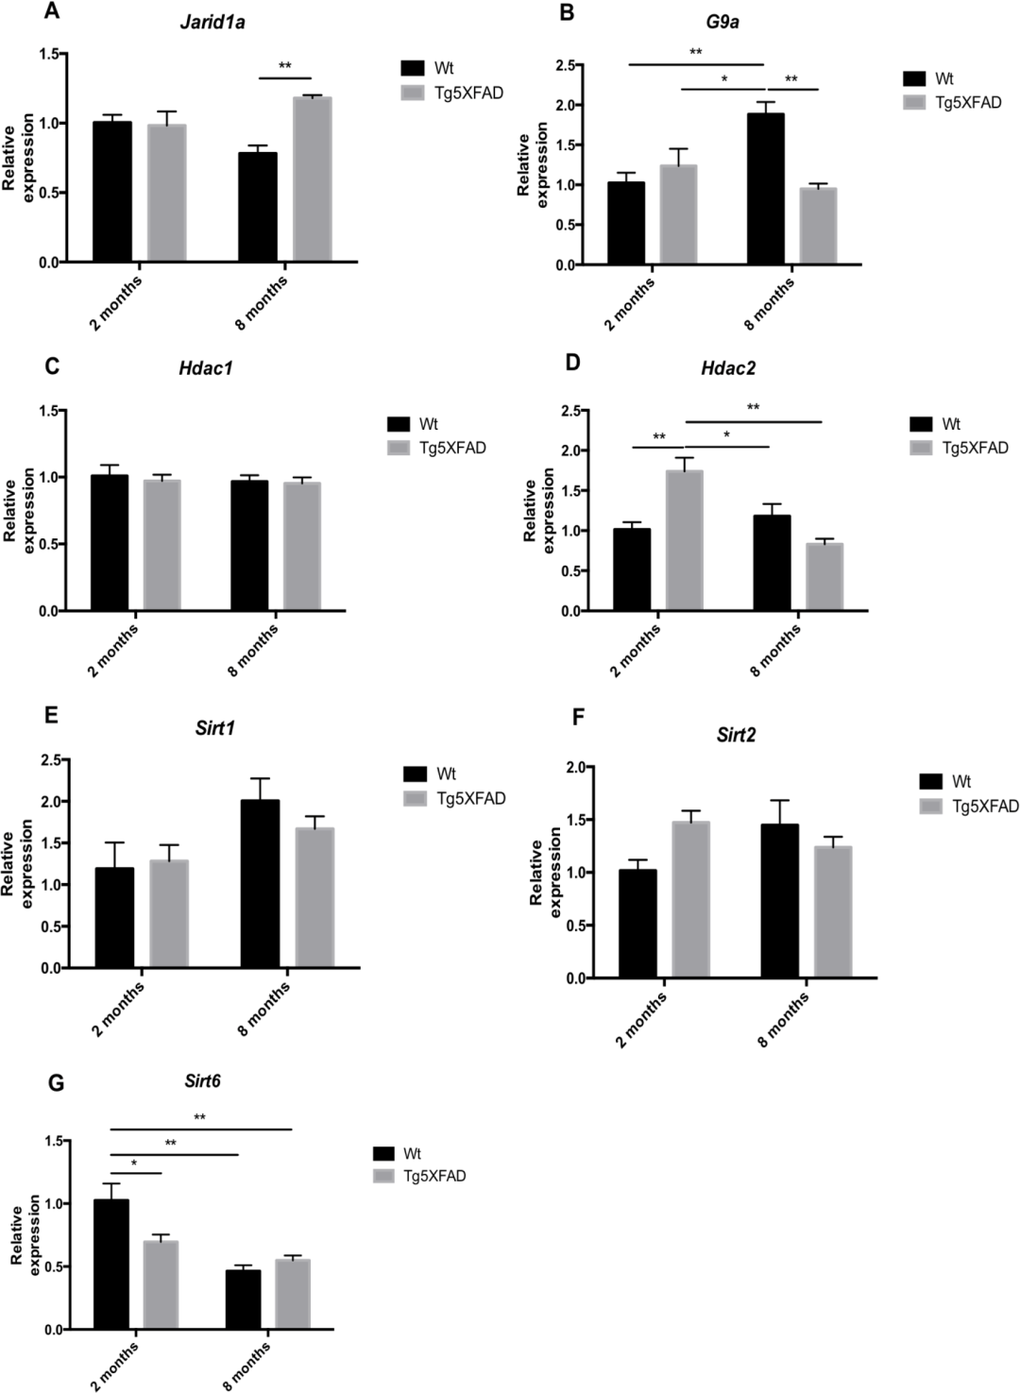
Figure 9.Gene expression for Jarid1a (A), G9a (B), Hdac1 (C), Hdac2 (D), Sirt1 (E), Sirt2 (F), and Sirt6 (G) in female mice aged 2 and 8 months (Wt and 5XFAD). Gene expression levels were determined by real-time PCR. Mean ± Standard Error of the Mean (SEM) from five independent experiments performed in triplicate are represented. *p<0.05; **p<0.01; ***p<0.001; ****p<0.0001.