Submit an Article
Navigate
Home
Editorial Board
Editorial Policies
Current Volume
Archive
Scientific Integrity
Publication Ethics Statements
Interviews with Outstanding Authors
Newsroom
Sponsored Conferences
Podcast
Contact
Special Collections
Submit an Article
Online ISSN: 1945-4589
Research Paper
|
Volume 8, Issue 5
|
pp. 848–859
Aging of immune system: immune signature from peripheral blood lymphocyte subsets in 1068 healthy adults
Back to article
Figure 1
(1 of 3)
−
100%
+
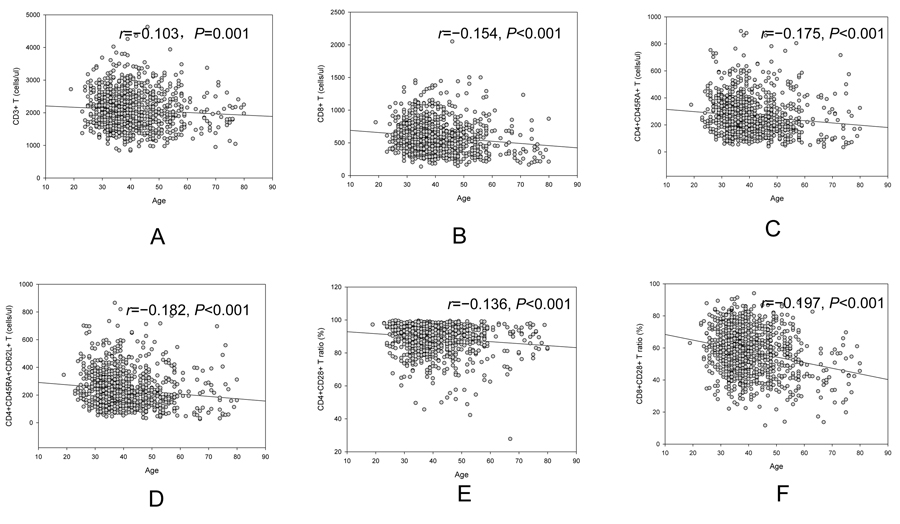
Figure 1.
Age related change of CD3+ cell (
A
), CD3+CD8+ (
B
), CD4+CD45RA+ cell (
C
), CD4+CD45RA+CD62L+ cell (
D
), CD4+CD28+ /CD4+ (
E
) and CD8+CD28+/CD8+ (
F
).